Alternative sampling strategies for antiepileptic drug monitoring
The continued use of first-generation antiepileptic drugs (AEDs) and their usually pronounced intra- and inter-individual variability, have made AEDs among the most common medications for which therapeutic drug monitoring (TDM) is performed. As the most cost-effective, rational and clinically useful methodologies are being pursued for TDM interventions, suitable sampling alternatives (e.g. dried blood samples and saliva) for the conventional venous sampling have been proposed.
by Sofie Velghe and Prof. Christophe P. Stove
Background
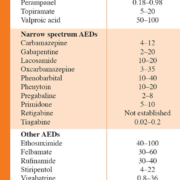
Administration of appropriate antiepileptic drugs (AEDs) is the mainstay in the attempt to provide epilepsy patients with a seizure-free, normal life. AEDs constitute a structurally and pharmacologically diverse group of drugs for which different criteria for classification are used, e.g. classification based on time of introduction by the pharmaceutical industry (i.e. first-, second- and third-generation of AEDs) [1]. In this way, carbamazepine (CBZ), phenytoin (PHT), phenobarbital (PB) and valproic acid (VPA) belong to the first-generation of AEDs, because of their introduction prior to 1990 [1]. Examples of the second-generation of AEDs are, among others, oxcarbazepine, vigabatrin and topiramate, whereas lacosamide, retigabine and eslicarbazepine are categorized as third-generation AEDs [1]. Another, clinically relevant classification is based on their spectrum of activity. Here, a distinction can be made between AEDs with a broad (i.e. effective against multiple types of seizures) and a narrow (i.e. effective against specific types of seizures for example focal epilepsy) spectrum [2]. Table 1 provides an overview of the licensed AEDs in Belgium, together with their plasma reference ranges, classified based on their activity spectrum. The treatment strategy of epilepsy is typically twofold: initially a treatment of acute tonic-clonic seizures, generally with benzodiazepines, is necessary, followed by an initiation of a chronic, preventive treatment with AEDs. Preferably, the latter consists of a monotherapy with one AED for which the dose is slowly titrated upwards when necessary. However, for some forms of epilepsy or in cases where a monotherapy at the maximum dosage is insufficient, a combination therapy with multiple AEDs is needed.
The generally narrow therapeutic indices, causing toxicity to be a common issue, together with their frequent use (i.e. for epilepsy, but also for pain and bipolar disorder) has made first-generation AEDs one of the most common medication groups for which therapeutic drug monitoring (TDM) is performed [3].
Owing to the large inter-individual variety in types of epilepsy and in the severity of epileptic seizures, the same dosage of an AED causes a symptom decrease in some patients, whereas in others epileptic seizures remain poorly controlled. Furthermore, some patients experience complete seizure control with an AED blood concentration below or above a set reference range, making TDM of AEDs quite challenging. Therefore, dosage adjustment should preferably be performed by combining the results of TDM with the clinical outcome. In other words, at the start of an AED treatment, a clinician must aim at obtaining an AED blood concentration within a set reference range, followed by a titration upwards or downwards, depending on the clinical symptoms. In this context, the concept of the ‘individual therapeutic concentration/range’ arose, being the AED concentration or range of concentrations for which an individual patient experiences an optimum response [4]. In order to define this ‘individual therapeutic concentration/range’, achieving the optimum desired clinical outcome can also be seen as an indication for TDM of AEDs. Determining the latter concentration or range can be performed for every AED, also including the AEDs for which a reference range is currently still lacking. To do so, the steady-state AED(s) concentration(s) should preferably be measured twice (2–4 months apart) once a patient has reached his/her optimum AED regimen [3].
Alternative sampling strategies for TDM of AEDs
Limitations coupled to the traditional way of performing TDM of AEDs (i.e. in plasma or serum samples) are the invasiveness of the sampling technique and the typically large amounts of blood that are sampled. In addition, sampling requires a phlebotomist, which obliges a visit to a hospital or doctor. Therefore, a growing interest in the use of non-invasive or minimally invasive alternative sampling strategies for TDM of AEDs has arisen. In this regard, dried blood spots (DBSs) are undoubtedly, besides oral fluid, the most widely used alternative matrix. On the one hand, benefits coupled to the use of DBSs are: (i) possibility of home sampling, since the samples are generally obtained by the use of a finger prick; (ii) non-contagious character, making it possible to send the samples via regular mail to a laboratory; (iii) only a small sample volume is necessary, which makes it very attractive for certain patients, such as those with anemia and young children; (iv) suitability for automation of sample processing and analysis; and (v) increased stability for many analytes, which can be of utmost importance for AEDs, given the controversy concerning the stability of some first-generation AEDs in serum collected via gel separator tubes [3, 5, 6]. On the other hand, DBS use also suffers from some challenges: (i) the small sample volume requires sensitive analytical instrumentation; (ii) risk of contamination; (iii) the hematocrit (Hct) effect; (iv) possibility of analyte concentration differences between capillary and venous blood; (v) adequate sampling is necessary, imposing the need for proper training of patients on the sampling technique; and (vi) influence of spotted blood volume and the punch location, especially when partial DBS punches are analysed [5, 6]. Among these challenges, the Hct effect is undoubtedly the most discussed issue related to DBS analysis. Variations in Hct influence the spreading of blood on the filter paper: blood with a higher Hct will spread less compared to blood with a lower Hct, impacting the spot size and spot homogeneity. Furthermore, the Hct may also influence matrix effect and recovery. With this impact in mind, many strategies to cope with this issue have been made over the past few years (reviewed in De Kesel et al. [7] and Velghe et al. [8]). Among these are volumetrically generated dried blood samples, which are analysed entirely. These could be DBSs on conventional filter paper [9], or, alternatively, samples generated via volumetric absorptive microsampling (VAMS) (Fig. 1), a technique by which a fixed volume of blood is wicked up via an absorbent tip [10]. We recently demonstrated the potential of VAMS for AED monitoring [11]. However, It needs to be stated that, if no large differences are anticipated in the Hct of the target population, it can be assumed that the impact of the Hct will remain limited and partial-punch analysis will likely not pose an issue for DBS-based AED analysis [12–14].
As TDM is most often performed on plasma or serum samples, reference ranges for AEDs are typically set for these matrices. Hence, if one wants to derive a plasma concentration from a (dried) blood concentration, there is a need for a ‘conversion’. This can be done by establishing average blood : plasma ratios or, alternatively, by plotting (dried) blood concentrations versus plasma concentrations of a reference set of samples and using the resulting calibration equation to derive ‘calculated plasma concentrations’ from a test set of samples. Obviously, this will also be accompanied with an additional level of uncertainty [11–14].
Alternatively, dried serum/plasma spots might be generated directly, using devices that contain filters that essentially allow passage of the liquid portion of blood but will stop the cellular portion [15–17]. Although several devices have been developed, it remains to be fully established (for AEDs, as well as for other analytes) whether the concentrations that can be derived from the resulting dried plasma/serum spots effectively mirror those in liquid plasma/serum.
Lastly, it should also be remarked that dried blood samples may also be used – without a need for conversion – for the follow-up of someone’s ‘individual therapeutic concentration/range’, once this has been established. On the one hand, this overcomes the need of using specialized dedicated devices, which typically come at an increased cost; on the other hand, this avoids the introduction of an additional level of conversion-associated uncertainty.
Conclusion
TDM of AEDs via DBS, VAMS or dried plasma/serum spots is an interesting application with the potential for a better follow-up of patients. Large-scale studies are warranted to substantiate the benefit for the patient and the corresponding potential associated cost savings.
References
1. Milosheska D, Grabnar I, Vovk T. Dried blood spots for monitoring and individualization of antiepileptic drug treatment. Eur J Pharm Sci 2015; 75: 25–39.
2. Commented drug code. BCFI 2018 (www.bcfi.be) [In Dutch/French].
3. Patsalos PN, Spencer EP, Berry DJ. Therapeutic drug monitoring of antiepileptic drugs in epilepsy: a 2018 update. TDM 2018; 40: 526–548.
4. Patsalos PN, Berry DJ, Bourgeois BF, Cloyd JC, Glauser TA, Johannessen SI, Leppik IE, Tomson T, Perucca E. Antiepileptic drugs – best practice guidelines for therapeutic drug monitoring: a position paper by the subcommission on therapeutic drug monitoring, ILAE Commission on Therapeutic Strategies. Epilepsia 2008; 49: 1239–1276.
5. Wilhelm AJ, den Burger JC, Swart EL. Therapeutic drug monitoring by dried blood spot: progress to date and future directions. Clin Pharmacokinet 2014; 53: 961–973.
6. Velghe S, Capiau S, Stove CP. Opening the toolbox of alternative sampling strategies in clinical routine: A key-role for (LC-)MS/MS. Trac-Trend Anal Chem 2016; 84: 61–73.
7. De Kesel PM, Sadones N, Capiau S, Lambert WE, Stove CP. Hemato-critical issues in quantitative analysis of dried blood spots: challenges and solutions. Bioanalysis 2013; 5: 2023–2041.
8. Velghe S, Delahaye L, Stove CP. Is the hematocrit still an issue in quantitative dried blood spot analysis? J Pharm Biomed Anal 2018; 163: 188–196.
9. Velghe S, Stove CP. Evaluation of the Capitainer-B Microfluidic device as a new hematocrit-independent alternative for dried blood spot collection. Anal Chem 2018; 90: 12893–12899.
10. Denniff P, Spooner N. Volumetric absorptive microsampling: a dried sample collection technique for quantitative bioanalysis. Anal Chem 2014; 86: 8489–8495.
11. Velghe S, Stove CP. Volumetric absorptive microsampling as an alternative tool for therapeutic drug monitoring of first-generation anti-epileptic drugs. Anal Bioanal Chem 2018; 410: 2331–2341.
12. Linder C, Andersson M, Wide K, Beck O, Pohanka A. A LC-MS/MS method for therapeutic drug monitoring of carbamazepine, lamotrigine and valproic acid in DBS. Bioanalysis 2015; 7: 2031–2039.
13. Linder C, Wide K, Walander M, Beck O, Gustafsson LL, Pohanka A. Comparison between dried blood spot and plasma sampling for therapeutic drug monitoring of antiepileptic drugs in children with epilepsy: A step towards home sampling. Clin Biochem 2017; 50: 418–424.
14. Linder C, Hansson A, Sadek S, Gustafsson LL, Pohanka A. Carbamazepine, lamotrigine, levetiracetam and valproic acid in dried blood spots with liquid chromatography tandem mass spectrometry; method development and validation. J Chrom B 2018; 1072: 116–122.
15. Ryona I, Henion J. A Book-type dried plasma spot card for automated flow-through elution coupled with online SPE-LC-MS/MS bioanalysis of opioids and stimulants in blood. Anal Chem 2016; 88: 11229–11237.
16. Kim JH, Woenker T, Adamec J, Regnier F. Simple, miniaturized blood plasma extraction method. Anal Chem 2013; 85: 11501–11508.
17. Hauser J, Lenk G, Hansson J, Beck O, Stemme G, Roxhed N. High-yield passive plasma filtration from human finger prick blood. Anal Chem 2018; 90: 13393–13399.
The authors
Sofie Velghe PharmD and Christophe P. Stove* PharmD, PhD
Laboratory of Toxicology, Department of Bioanalysis, Faculty of Pharmaceutical Sciences, Ghent University, 9000 Ghent, Belgium
*Corresponding author
E-mail: christophe.stove@ugent.be


