Benefits of polychromatic flow cytometry in a clinical setting
Increasingly sophisticated instruments and an expanding range of fluorochromes are making it possible to detect an increasing number of markers on a single cell. These advances are encouraging the wider adoption of polychromatic flow cytometry (PFC). This review looks at the benefits of PFC in clinical laboratories, and how to deal with the associated challenges.
by Sandy Smith and Professor William Sewell
Flow cytometry is a valuable tool in today’s diagnostic pathology laboratories [1]. The main strengths of flow cytometry are the ability to detect and characterise abnormal populations, the capacity to assess several markers simultaneously on the one cell and the relative speed with which results can be produced. In recent years, there has been a progressive introduction into clinical laboratories of polychromatic flow cytometry (PFC), using instruments that detect 5–10 markers simultaneously. This paper will focus on how increasing colours can impact a clinical flow cytometry laboratory.
The advantages of PFC
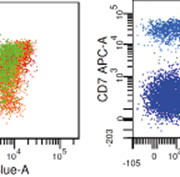
Arguably the biggest impact of increasing colours is the exponential increase in the amount of information obtained from paucicellular samples, such as cerebrospinal fluid (CSF). Often all the sample needs to be committed to a single tube to obtain enough events. Studies have shown flow cytometry improves the detection rate of CSF involvement of haematopoietic neoplasms [2]. With low cell numbers, background events become a significant proportion of total events, thus having sufficient colours available to include a nuclear stain can be very useful to identify true cells from debris. Another major benefit of increased colours is in the analysis of complex populations [3]. Light chain expression is the key to demonstrating monoclonality on B cell populations, so the more markers in the light chain tube, the better the sensitivity. The availability of more markers increases the ability to separate populations and analyse them independently. T cell phenotyping is significantly more complex than for B cells [4], and PFC can improve the effectiveness of panels investigating T cell disorders. However specificity becomes an issue since there are often many T cell subsets in reactive samples. CD7 negativity is used to identify some T-NHL cells, however CD7 negative populations are commonly found in normal samples. False negativity can be reduced by appropriate selection of clones and fluorochromes, and we have found that switching CD7 from FITC to APC has reduced the amount of dim-negative populations [Fig. 1]. However, T cell malignancies are relatively rare thus would rarely justify an instrument upgrade alone. PFC can aid in the detection of minimal residual disease (MRD) populations, by allowing the inclusion of more markers to identify targeted populations. In recent years, MRD detection has benefitted from developments in instrumentation that improve consistency in settings over different collection time points, and improved computers and software packages that allow fast analysis of >500,000 events. As these technologies are more widely adopted, the benefits of PFC will have a greater impact in MRD detection. PFC has made panel construction both easier and harder. Using more colours means fewer decisions when assigning markers to tubes, but this will be limited by the range of conjugates for rarer fluorochromes, and complicated by compensation and spreading. Sorting out compensations for overlapping fluorochrome emissions does become more complex with more fluorochromes, but is reduced when they are excited by different lasers. With advances in software, compensation can be managed with automated matrices and manual optimisation by experienced users. Although there is an increased range of fluorochromes, it is helpful to use one fluorochrome per channel (i.e. always FITC or always AF488) to avoid generating and maintaining too many separate settings files. The spreading effect is the expansion either side of the zero point of an axis due to the bright positive intensity of a second fluorochrome [Fig. 2]. This phenomenon is unique to instruments producing digital data, and can be managed by arranging mutually exclusive combinations on affected fluorochromes [5].
Quality control
Increasing the number of colours does not increase the number of QC procedures, however these can become more complex as there are more things that could go wrong. No matter how many colours are used, any lab will still need daily bead calibration to ensure consistent instrument operation, plus a biological control to ensure appropriate assay and acquisition set up. Upgraded instruments will have more detectors, lasers and fluorochromes to check, therefore a greater knowledge base is required to troubleshoot problems. Labs with the expertise to resolve technical issues in-house will have less instrument downtime. For biological controls, a very effective form of QC is to utilise internal controls, which are negatively stained cells in the same sample. These are independent of the number and type of fluorochromes used and are especially useful in high throughput labs.
Data handling
As the number of colours increase, the information becomes harder to express in traditional graphic form [6]. Standard graphs are two-dimensional; gates can be combined in Boolean formulas, but each region is still adjusted in two dimensions. The number of graphs required to display each marker against each other marker increases. Careful planning should enable each lymphocyte marker to be shown only once for each tube in panels targeting lymphocyte lineage neoplasms, reducing the time taken to review data. In myeloid panels the emphasis is on tracking development pathways, thus some markers are required to help track multiple pathways. For example, CD33 is useful for blasts, and for both monocytic and granulocytic development. Another strategy to clarify data is to use colour schemes to track cells on different 2D plots from one tube; these schemes can then be applied to all tubes in the panel to help tie the information together. Traditionally, analysis software has been provided by the cytometer manufacturer. However, the increased complexity of analysis in PFC means that specialist software companies are playing a greater role. For the next stage of software development, many of these companies are developing complex algorithms to define clusters of cells in multi-dimensional space in a way that the traditional approach of sequential gating cannot. However the main issue seems to be around expression of the data in a user friendly way so that subtle populations can be visualised in a persuasive fashion.
Technology development
In recent years, there have been efforts to standardise antibody panels. Increasing colours can make the choice of which markers to combine in the same tube easier, and allows ‘backbone’ markers to be included. Backbone markers refer to markers used in every tube of a panel to allow more specific gating across tubes; an example of B cell panel markers in multiple tubes is shown in Table 1. Various international groups have recommended approaches to standardisation [7]. However adoption has been slow, likely for practical reasons. Increasing colours increases information, but also complexity of analysis and range of technical issues, thus staff need to have a greater knowledge and experience. This issue is worthy of its own paper so is not discussed in depth here; major issues are listed in Table 2. Labs tend to use reagents recommended by their instrument manufacturer which makes technical support easier. The appropriate number of colours and most suitable instrumentation for each laboratory is very site specific, which decreases the capacity for standardisation. It is desirable, and indeed more practical, to standardise user expertise; the implementation of the International Cytometry Certification Examination is a significant first step.
Fluorochrome availability and cost
The average number of colours used in the clinical world depends on both suppliers and labs. It requires a critical mass of usage from laboratories to make a larger range of fluorochromes and conjugates commercially viable. As the increased range is more widely adopted, experience increases and more suppliers take on larger ranges, thus prices may be reduced; both of which encourage more laboratories to upgrade their systems, and so on. This cycle relies on both commercial investment in new technologies, as well as laboratories investing resources to trial and optimise these technologies. In labs this tends to rely on individuals being personally motivated plus supported by the lab, which is difficult in the current economic climate. One solution is for multiple sites to pool resources, for one centre to investigate and implement options, which can then be adopted and optimised by all. Also, research groups will concentrate resources into creating single panels to glean maximum information from samples. Here, the more unusual fluorochromes and instruments can be tested and optimised, and these experiences passed onto clinical users.
Conclusion
Practicalities and cost effectiveness will always play a part in the future directions of clinical flow cytometry labs. There are many benefits to increasing the colour capabilities of clinical labs. More information can be taken from each assay tube improving sensitivity for abnormal populations in a normal or reactive background and in the analysis of paucicellular specimens. Workflow can also improve with fewer tubes to run. More colours will potentially lead to more technical issues and more resources for trial and validation; ultimately the availability of resources will dictate the appropriate number of colours for each laboratory. Labs should regularly assess how many colours would be of benefit to them, and how many colours they can handle. These developments will continue to enhance the contribution of flow cytometry to laboratory diagnosis.
References
1. Craig FE, Foon KA. Blood 2008; 111: 3941–3967.
2. de Graaf MT, de Jongste AH, et al. Cytometry B Clin Cytom 2011; 80: 271–281.
3. Sewell WA, Smith SA. Pathology 2011; 43: 580–591.
4. Tembhare P, Yuan CM, Xi L, et al. Am J Clin Pathol 2011; 135: 890–900.
5. Roederer M. Cytometry 2001; 45: 194–205.
6. Mahnke YD, Roederer M. Clin Lab Med 2007; 27: 469–485, v.
7. Davis BH, Holden JT, et al. Cytometry B Clin Cytom 2007; 72(S 1): S5–13.
The authors
Sandy ABC Smith1 MSc, and William A Sewell1,2,3 MBBS, PhD
1 Immunology Department, SydPath, St Vincent’s Pathology, St Vincent’s Hospital Sydney, Victoria St, Darlinghurst, NSW 2010, Australia.
2 St Vincent’s Clinical School, University of NSW, NSW 2052, Australia.
3 Garvan Institute of Medical Research, Victoria St, Darlinghurst, NSW 2010, Australia


