Chromosomal rearrangement detection in lymphomas: digital FISH analysis
Detection of chromosomal rearrangements using fluorescence
in situ hybridization (FISH) in lymphomas is an important diagnostic measure for treating this aggressive tumour type. This article aims to describe the recent advancements in the technology.
by Dr Michael Liew, Leslie Rowe and Prof. Mohamed E. Salama
Background
Lymphomas are cancers that affect cells of the lymphatic or immune system, affect a wide range of age groups and are not gender specific. Differentiation of different lymphomas types is important for prognosis and treatment regimens. Lymphomas can be differentiated according to the chromosomal rearrangements they have undergone. For example, Burkitt’s lymphoma is characterized by a rearrangement in the MYC gene (8q24). Diffuse large B-cell lymphoma (DLBCL) is a very aggressive tumour that is characterized by multiple gene rearrangements involving MYC, IGH, BCL2 or BCL6. Mantle cell lymphomas are characterized by the presence of the CCND1 gene rearrangement. All of these rearrangements are routinely detected by fluorescence in situ hybridization (FISH) [1].
Digital FISH analysis
Microscope slides prepared for FISH analysis are still currently viewed by eye using an epifluorescence microscope. An emerging technology is digital FISH analysis. The microscope slides are prepared in the same way, but the fluorescent signals are captured and analysed digitally. The entire field of microscopy has benefited from whole slide imaging (WSI). This enables the capture, analysis, storage and sharing of whole slide pathology images [2]. However, WSI is still in its infancy as a diagnostic tool because there is a lack of evidence that it can be used as a primary diagnostic tool compared to viewing the slide directly with a traditional microscope. Similarly FISH analysis of a tissue slide is starting to become digitized and laboratories are validating its use diagnostically.
There are three main components to digital FISH analysis. The first component, which is critical for its accuracy, is the need for z-stacking of multiple digital images for FISH applications. This is in contrast to WSI for bright field microscopy, which only needs to capture a single digital image. The second component is the identification, or segmentation, of individually stained nuclei that have been stained with a fluorescent dye, such as DAPI. With a suspension of cells, having software that identifies isolated nuclei is relatively straightforward. However, the digital analysis of formalin-fixed paraffin-embedded (FFPE) tissue sections, which can be more clinically informative, can be more challenging. The final component of digital FISH analysis is the signal count, or signal classification. Digital FISH analysis provides a powerful way of documenting and analysing, what can be complex signal patterns.
Validation of digital FISH assays
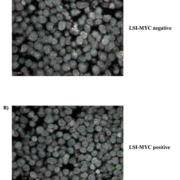
Our laboratory has validated digital FISH assays for the detection of MYC rearrangements in FFPE tissue (Fig. 1) [3]. We demonstrated a good correlation between traditional and digital FISH analysis for MYC rearrangements using both locus specific identifier (LSI) break-apart and IGH-MYC fusion probes. Our findings document improved diagnostic accuracy with the implementation of digital FISH analysis. Segmented and classified digital images allow for permanent storage of analysed specimens and easy accessibility for further review and/or educational purposes. The digital platform is also conducive to laboratory workflow as it allows timely segmentation and classification of nuclei, remote access for review of cases, elimination of manual slide transportation, and accurate identification/assessment of tumour from digital tissue matching.
We are not the first to adopt digital FISH analysis; however, we are among the first efforts to validate the system for clinical use, and results are in good agreement with previous studies that looked at automated analysis of FISH results from FFPE B-cell lymphoma tissue [4, 5]. The automated analysis yielded 100% agreement with conventional FISH in both studies. In contrast though, the amount of time it took to analyse a sample was approximately twice as long as the previous study. This difference in time was due to the manual editing required when using the digital system particularly in the initial phases of validation, whereas the other system was able to rely more on the automated analysis. We are developing the current workflow and system to reduce this step.
Implementation of digital FISH
The primary cost of switching over to a digital FISH system from a manual system is the new hardware including computer, scanning system and slide loaders. The digital FISH system increases the cost of a stand-alone epifluorescence microscope significantly. Depending upon whether whole slide images are captured, or just a few fields of view, additional computer servers may be needed for data storage. The promise is that if the digital FISH analysis is completely automated, and the results are 100% accurate, it is faster than manual FISH analysis. From our experience though, additional development is needed to reach the 100% accuracy and much development is needed to minimize the time needs to be spent manually editing the results. However, using the digital FISH analysis versus current direct visualization of the FISH slide with manual recording of a scoresheet, will come with several benefits including automatic digitized records and the possibility of remote connectivity for pathologists; to mention a few.
Future perspectives
There are several future considerations that arise from developing digital FISH imaging. WSI of a FISH slide is a possible application in digital FISH imaging. Similar to imaging an entire hematoxylin and eosin (H&E)-stained slide, it would mean that the entire section could be analysed, minimizing the possibility that a small area of tumour may be missed. However, magnification is an issue. FISH slides need to be analysed under higher magnification (at least 60×) to maintain the resolution between signals. Coupled with the acquisition of multiple z-stacked images, this would make the scanning time longer, and the image files extremely large, making data storage an issue. In addition, FDA concerns over digital pathology will affect future regulation of digital FISH analysis. This will mean that validated assays that are developed in the future will need to demonstrate that there is no loss of accuracy using a computer versus an epifluorescence microscope. Image formats, resolution and compression are important factors in accurate interpretation of digital FISH images. For the most accurate digital FISH data, images that do not lose data during compression (ie. TIF LZW or PNG) should be used. The drawback is that data storage becomes an issue, since files stay large, but is important to maintain image quality and accuracy.
Conclusion
Digital capture and analysis of FISH assays are a positive development for this important laboratory testing modality. The MYC FISH assays which we have converted to our digital imaging platform have provided numerous logistical and diagnostic advantages as indicated previously. In addition, individual signal patterns can be recorded and stored. These data alongside advances in computational power can potentially lead to correlation between signal pattern and unique tumour phenotypes, or overall tumour prognosis. There are still limitations to digital FISH analysis, in particular being able to reliably identify nuclei and hybridized signal. However, since the resolution of digital FISH images will only increase, and the algorithms used for detection of nuclei and signals will continually be refined, digital FISH analysis can only improve. As indicated, we feel that digital FISH analysis provides more efficient and accurate results and better patient care in comparison to traditional FISH methods. Efforts to convert other FFPE-based FISH assays to this digital platform are underway in our laboratory.
Acknowledgements
This work was funded by the Institute for Clinical and Experimental Pathology, ARUP Laboratories.
References
1. Martin-Subero JI, Gesk S, Harder L, Grote W, Siebert R. Interphase cytogenetics of hematological neoplasms under the perspective of the novel WHO classification. Anticancer Res. 2003; 23: 1139–1148.
2. Goacher E, Randell R, Williams B, Treanor D. The diagnostic concordance of whole slide imaging and light microscopy: a systematic review. Arch Pathol Lab Med. 2016; doi: http://dx.doi.org/10.5858/arpa.2016-0025-RA [Epub ahead of print].
3. Liew M, Rowe L, Clement PW, Miles RR, Salama ME. Validation of break-apart and fusion MYC probes using a digital fluorescence in situ hybridization capture and imaging system. J Pathol Inform. 2016; 7: 20.
4. Alpár D1, Hermesz J, Pótó L, László R, Kereskai L, Jáksó P, Pajor G, Pajor L, Kajtár B. Automated FISH analysis using dual-fusion and break-apart probes on paraffin-embedded tissue sections. Cytometry A. 2008; 73: 651–657.
5. Reichard KK, Hall BK, Corn A, Foucar MK, Hozier J. Automated analysis of fluorescence in situ hybridization on fixed, paraffin-embedded whole tissue sections in B-cell lymphoma. Mod Pathol. 2006; 19: 1027–1033.
The authors
Michael Liew1 PhD, Leslie Rowe1 MS, Mohamed E. Salama1, 2 MD
1ARUP Institute for Clinical and
Experimental Pathology, Salt Lake City, UT, USA
2Department of Pathology, University of Utah School of Medicine, Salt Lake City, UT, USA
*Corresponding author
E-mail: liewm@aruplab.com


