Beukenlaan 137
5616 VD Eindhoven
The Netherlands
+31 85064 55 82
info@clinlabint.com
PanGlobal Media is not responsible for any error or omission that might occur in the electronic display of product or company data.
Quantitative specific drug analysis by tandem mass spectrometry allows a wide range of drugs to be analysed in either urine or oral fluid to confirmation standards. The repertoire of drugs is based on drugs of abuse implicated in drug-related deaths in Scotland and currently includes 27 specific drugs and metabolites.
by Dr Paul Cawood and Joanne McCauley
Background
Drugs of abuse have traditionally been identified by immunoassay screening methods. Some of these are relatively non-specific and require second-line confirmatory tests, traditionally by gas chromatography–mass spectrometry (GC-MS). As drugs are not volatile this requires derivatization to render the drugs volatile. Tandem mass spectrometry (TMS) has the advantage that samples can be analysed directly without derivatization.
Drug-related deaths in Scotland are the highest in Europe and are increasing steeply [1, 2], even though the number of substance misusers has not changed recently. Most deaths are due to accidental overdosing with opiates, which causes death from heart or respiratory failure. The steep increase is the result of poly-drug use, with gabapentin/pregabalin and street benzodiazepines (such as etizolam and alprazolam) implicated in a large number of these deaths. Identification of many of these drugs is not possible by traditional immunoassay screening methods even with GC-MS confirmation. However, it is possible to identify many of these drugs by TMS.
Specific quantitative drug analysis by TMS
Urine and oral fluid drugs of abuse method
A rapid method for the analysis of drugs of abuse in urine has been reported previously [3]. This method has been modified for the analysis of drugs implicated in drug-related deaths in Scotland [2]. One transition per drug can increase the risk of false-positive results [4]; hence, each drug has two transitions and a closely matched deuterated internal standard in order to avoid these issues. Calibrators and quality control samples are made from Ceriliant certified standards. The standard set comprises morphine, codeine, 6-monoacetyl morphine (6-MAM), dihydrocodeine (DHC), oxycodone, gabapentin, pregabalin, methadone, EDDP (2-ethylidene-1,5-dimethyl-3,3-diphenylpyrrolidine, methadone metabolite), buprenorphine, norbuprenorphine, tramadol, amphetamine, 3,4-methylenedioxymethamphetamine (MDMA, or ecstasy) , methamphetamine, cocaine, benzoyl ecgonine (BEC), diazepam, nordiazepam, temazepam, oxazepam, 7-amino-clonazepam, nitrazepam, alprazolam, diclazepam, delorazepam and etizolam. Stock standard solution is made by adding 100 µg of each standard to a 20 ml volumetric flask, resulting in 5 000 µg/L. Calibrators are prepared at: 5, 10, 20, 30, 100, 300 and 1000 µg/L with quality controls at 10, 20, 50, 100, 300 and 400 µg/L in 3 % human serum albumin. The albumin prevents non-specific binding to the container.
Spot urine samples are collected in universal containers and oral fluid is collected into a Sarstedt salivette cortisol collection device (without preservative).
50 µL of calibrator, quality control, patient urine or oral fluid has 20 µL of zinc sulphate (0.1 mol/L) and 150 µL internal standard mixture (containing 17 deuterated internal standards – 1 µg/100 mL methanol) added. The sample is mixed and centrifuged. 75 µL of supernatant is removed and added to 300 µL of water. A volume of 20 µL is injected.
TMS analysis
Samples are analysed on a Waters Xevo tandem mass spectrometer using a Waters Acquity ultra high performance liquid chromatography HSS C18 1.8 µm, 100 mm column at 50 °C. The sample is eluted using a multi-step gradient of water (1 % formic acid 2 mM ammonium acetate) and acetonitrile (1 % formic acid), starting at 98 % water/2 % acetonitrile to 63 % / 37 % at 3.4 min then to 5 % / 95 % at 4.5 min, reverting to 98 %/2 % at 5.2 min (Fig. 1).
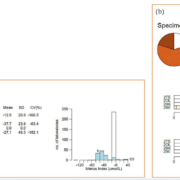
Drugs are identified using the quantitative ion transition having the same peak shape as the qualitative ion transition; retention times need to match the corresponding deuterated internal standard and the quantifying ion to qualifying ion ratio matches that of the calibrators (Fig. 2). Drugs are reported as positive when above the corresponding threshold level. Threshold levels are broadly based on Driving Under the Influence of Drugs (DRUID) or European Workplace Drug Testing Society (EWDTS) confirmation test levels for both urine and oral fluid (Table 1).
We analyse 4 000 urine and 17 000 oral fluid samples each year. These are predominantly from drug problem users (Fig. 3).
Drugs of abuse in urine
TMS has the advantage of greatly reducing false-positive results seen with immunoassay methods and negating the need for second-line confirmatory tests. However, the use of urine as a sample medium still has a number of disadvantages: it is susceptible to adulteration or spiking with drugs; sample collection is not witnessed; urine drug concentrations vary depending on hydration status. This can affect whether a drug is reported as positive or negative relative to threshold levels. Additionally, some drugs are excreted relatively unchanged in urine, whereas other drugs are highly metabolized and conjugated, in which case unchanged parent drug levels can be low. In order to keep the sample preparation simple it was decided not to hydrolyse drugs in urine but to measure predominantly parent drugs, including metabolites only where necessary. This required threshold levels to be adjusted to give comparable positivity to immunoassay methods (Table 1).
Drugs of abuse in oral fluid
Oral fluid overcomes many of the disadvantages of urine: sample collection can be witnessed; samples cannot be adulterated or spiked; and threshold levels are not affected by hydration status. Since we have offered an oral fluid service most clinicians have switched from urine to oral fluid testing. Parent drugs predominate in oral fluid, with metabolite levels being generally absent or uninformative, with the exception of BEC and nordiazepam. Drugs are predominantly weak bases and diffuse from serum (pH 7.4) into oral fluid (pH 4.0–6.0). As such, some drugs are then unable to diffuse back out again. This can result in oral fluid drug levels being higher in oral fluid than in blood. Levels can remain positive for longer in oral fluid than in blood or urine, giving a longer duration of detectability for some drugs (Table 1) [5].
Opiates
Heroin contains diacetyl morphine and acetyl codeine. Both of these are rapidly metabolized into 6-MAM and codeine respectively. Both 6-MAM and codeine further metabolize to morphine. Morphine is the major excretory product of heroin in urine and is detectable in urine up to 72 h after heroin has been taken [6]. Finding 6-MAM confirms heroin has been taken. Finding codeine in the absence of 6-MAM is also compatible with codeine consumption. 6-MAM is the major heroin component in oral fluid and this always indicates heroin use. Morphine and codeine levels are generally lower than 6-MAM in oral fluid. Finding morphine in oral fluid, in the absence of 6-MAM or codeine usually indicates a pure morphine preparation has been taken. Long detection times for 6-MAM in oral fluid have been reported in a Norwegian study which analysed daily blood, urine and oral fluid samples in 20 heroin overdose cases. They reported that 6-MAM can remain positive in oral fluid for 5 days or more after heroin had been taken. In one case, the heroin test was positive 8 days after exposure [7]. Dihydrocodeine, tramadol and oxycodone can be readily identified in both urine and oral fluid.
Cocaine
Cocaine is rapidly metabolized into BEC. BEC is better than cocaine as a urine marker of cocaine use, and can be detected for 48–72 h after cocaine use [6]. However, cocaine predominates in oral fluid at much higher levels than BEC. Cocaine can remain positive in oral fluid for up to 5 days after cocaine has been taken.
Methadone/buprenorphine
Methadone and buprenorphine are prescribed for the treatment of opioid dependence and are metabolized into EDDP and norbuprenorphine, respectively. EDDP/methadone and norbuprenorphine/buprenorphine concentrations are measured in urine. Usually EDDP levels are significantly higher than methadone. Norbuprenorphine levels are usually much higher than buprenorphine. Finding methadone/buprenorphine levels greater than EDDP/norbuprenorphine indicates the sample has been spiked. Parent methadone and buprenorphine appear in oral fluid whereas EDDP and norbuprenorphine do not. Buprenorphine is administered sublingually and levels in oral fluid are very high in samples collected immediately after administration. To avoid this, oral fluid samples should not be collected within 1 h of the buprenorphine dose. Buprenorphine half-life varies from 2 to 24 h [8] and oral fluid can be negative for buprenorphine if the sample is collected the next day after a low dose.
Amphetamines
Amphetamine, MDMA and methamphetamine are excreted relative unchanged in urine. Hence, parent drugs are analysed in both urine and oral fluid.
Gabapentinoids
Gabapentin and pregabalin are predominantly excreted unchanged in urine so the parent drug is readily detected in both urine and oral fluid. A survey of substance misusers in Lothian in 2012 indicated that gabapentin was taken to potentiate the high obtained from methadone and to increase the level of intoxication [9]. 92 % of sample positive for gabapentinoids are also positive for methadone or buprenorphine confirming that these drugs are taken to boost the intoxicating effects of opiate and opioids.
Benzodiazepines
These drugs are highly metabolized and conjugated with only a small amount of parent drug excreted unchanged in urine. As such threshold levels are much lower than immunoassay screening methods. Diazepam metabolizes into nordiazepam and temazepam, both of which metabolize into oxazepam. Nordiazepam is also a metabolite of chlordiazepoxide. Finding diazepam, nordiazepam, temazepam and/or oxazepam is consistent with diazepam. Finding nordiazepam in the absence of diazepam is also consistent with chlordiazepoxide. Nordiazepam has a longer half-life than both diazepam and chlordiazepoxide and remains positive for longer than either parent drug. Detecting temazepam only, nitrazepam only or oxazepam only is consistent with those drugs being taken. These patterns persist in both urine and oral fluid, although threshold levels are lower in oral fluid compared to urine (Table 1).
Street benzodiazepines
Following the 2016 drug-related deaths Scotland report [1] we introduced testing for etizolam, delorazepam, diclazepam and alprazolam into the standard set. These drugs are generally not available by prescription in the UK. Alprazolam and etizolam are short acting, whereas delorazepam and diclazepam are long acting. Alprazolam is six times more potent than diazepam [10].
Conclusion and future developments
Gabapentinoid use is widespread and is almost always used to potentiate methadone and other opiates or opioids. There is an increasing trend for more potent street benzodiazepines. This poly-drug use has a detrimental effect on judgement and behaviour leading to inadvertent overdosing. Poly-drug use is the main reason for the increase in drug-related deaths in Scotland in recent years [2]. Identifying the main drugs implicated in these deaths is only possible by TMS. In the future, additional drugs can be considered for inclusion, such as phenazepam (30 deaths in 2017); flubromazepam (9); fentanyl (15); mirtazapine (59); amitriptyline (36); sertraline (12); fluoxetine (12); olanzapine (9); quetiapine (11) and zopiclone (29). There is evidence that these are being abused by substance misuse clients and these are all implicated in significant numbers of drug-related deaths in Scotland [11].
References
1. Drug-related deaths in Scotland in 2016. A National Statistics report for Scotland. National Records of Scotland 2017 (https://www.nrscotland.gov.uk/files//statistics/drug-related-deaths/drd2016/drug-related-deaths-16-pub.pdf).
2. Drug-related deaths in Scotland in 2017. A National Statistics report for Scotland. National Records of Scotland 2018 (https://www.nrscotland.gov.uk/files//statistics/drug-related-deaths/17/drug-related-deaths-17-pub.pdf).
3. Eichhorst JC, Etter ML, Rousseaux N, Lehotay DC. Drugs of abuse by tandem mass spectrometry: a rapid, simple method to replace immunoassays. Clin Biochem 2009; 42: 1531–1542.
4. Sauvage FL, Gaulier JM, Lachatre G, Marquet P. Pitfalls and prevention strategies for liquid chromatography-tandem mass spectrometry in selected reaction-monitoring mode for drug analysis. Clin Chem 2008; 54(9): 1519–1527.
5. Bosker WM, Huestis MA. Oral fluid testing for drugs of abuse. Clin Chem 2009; 55(11): 1910–1931.
6. Baselt RC, Cravey RH. Disposition of toxic drugs and chemicals in man. 4th edition. Chemical Toxicology Institute 1995; IBSN: 978-0962652318.
7. Baird CRW, Fox P, Colvin LA. Gabapentinoid abuse in order to potentiate the effects of methadone: a survey among substance misusers. Eur Addict Res 2014; 20(3): 115–118.
8. Kuhlman JJ Jr, Lanlani S, Magluilo J, Levine B, Darwin WD. Human pharmacokinetics of intravenous, sublingual and buccal buprenorphine. J Anal Toxicol 1996; 20(6): 369–378.
9. Vindenes V, Enger A, Nordal K, Johansen U, Christophersen AS, Øiestad EL. Very long detection times after high and repeated intake of heroin and methadone, measured in oral fluid. Forensic Sci 2014; 20(2): 34–41.
10. Aden GC, Thein SG Jr. Alprazolam compared to diazepam and placebo in the treatment of anxiety. J Clin Psychiatry 1980; 41(7): 245–248.
11. Barnsdale L, Gounari X, Graham L. The National Drug-Related Deaths Database (Scotland) Report. Analysis of deaths occurring in 2015 and 2016. Information Services Division, NHS National Services Scotland 2018 (https://www.isdscotland.org/Health-Topics/Drugs-and-Alcohol-Misuse/Publications/2018-06-12/2018-06-12-NDRDD-Report.pdf).
The authors
Paul Cawood* PhD
Joanne McCauley BSc
Department of Clinical Biochemistry, Royal Infirmary of Edinburgh, Edinburgh, UK
*Corresponding author
E-mail: Paul.cawood@nhs.net
Recently I heard on BBC Radio 4 a fascinating interview of Professor George Jelineck by Caroline Quentin, both of whom suffer from multiple sclerosis (MS). MS, as no doubt you know, is a condition caused by the demyelination of neurons as the result of attack by the body’s own Th1 cells, usually resulting in progressive debilitation. There are a number of ‘types’ of MS that people can be classified as having, commonly: relapsing–remitting MS, secondary progressive MS, primary progressive MS; but also including progressive relapsing MS and benign MS. However, diagnosis is not straightforward and people can move between types as the condition progresses. It is estimated that there are perhaps around 2.5 million people worldwide living with MS and the incidence is higher in people living in colder climates. George Jelineck MBBS, MD is professor and founder of the Neuroepidemiology Unit, Melbourne School of Population and Global Health, which expressly evaluates modifiable risk factors that predict the progression of MS, as well as having set up the Overcoming Multiple Sclerosis charity and being author of the Overcoming Multiple Sclerosis book. George was diagnosed with MS in 1999 at the age of 45, having seen his mother’s progressive deterioration because of the disease. Initially devastated at the diagnosis, he quickly turned his medical knowledge and capabilities to researching the literature about MS and created an evidence-based wellness programme for himself, to which he credits his continuing good health and apparent symptom-free life. The programme includes modifications to diet [following the striking results of Swank and Duggan (Lancet 1990; 336(8706): 37–39)], ensuring adequate vitamin D levels as well as care of general physical and mental health. It seems to be becoming generally accepted that MS is caused by a coincidence of a number of environmental factors (including low vitamin D levels) on top of a genetic predisposition. The impact of this for clinical diagnostics has been the upsurge of interest in testing vitamin D levels in the last decade. Interestingly, George mentioned in the interview that when mothers with MS give birth at the end of the winter, their child is much more likely to develop MS also. The solution is simply to supplement vitamin D levels, which could easily be done across the population, similarly to folic acid. Currently there is no simple genetic test for predisposition to MS, but perhaps further work with genome-wide association, such as that published recently by the International Multiple Sclerosis Genetics Consortium (Nat Commun 2019; 10(1): 2236), will eventually lead to a genetic screen for MS risk, allowing those predisposed to it to alter their modifiable risk factors and so reduce the development/impact of the condition before the appearance of symptoms.
Extraction of nucleic acids from patient samples is an essential step for downstream molecular studies such as quantitative and qualitative PCR. The size of the DNA fragments present in samples can influence extraction efficiency, especially observed in circulating cell-free DNA (cfDNA). Further work is necessary to determine the impact of cfDNA extraction on clinical virology and microbiology testing.
by Dr Kimberly Starr and Dr Linda Cook
Introduction
After sample collection, the next important step in the detection of infectious agents in most patient-derived samples is the extraction of DNA or RNA to remove proteins, lipids, other cellular components, and PCR inhibitors to create a ‘PCR-friendly’ eluate solution. First, the sample is mixed with a lysis buffer and then DNA is purified from the resulting solution by silica-coated filtration membranes or magnetic beads that bind nucleic acid and allow subsequent washing and elution steps to be performed. Extraction methods can range from small-scale manual methods to large-scale fully-automated extraction instruments. For implementation of automated platforms several factors require consideration, including capacity, target range, efficiency, cost, physical footprint, level of automation, and processing time. The variety of instrumentation and extraction methods available contribute to the differences in extraction efficiency that may have downstream consequences when quantifying DNA or RNA in bacteria, fungi, parasites, and viruses. The performance of different kits even on the same instrument can further contribute to variation in efficiency [1]. Inter-laboratory variation as a result of extraction efficiency can affect patient care and reproducibility of testing results, especially for patients who are monitored over a long period with a quantitative test.
Extraction method comparisons
In a study comparing the bacterial DNA quantity and quality extracted from stool, Claassen et al. found DNA yield and purity varied between five commonly used extraction kits [2]. This is the case for fungi as well where extraction of nucleic acid from Aspergillus fumigatus is the main limiting factor for successful Aspergillus PCR from clinical specimens. Perry et al. found differences in reproducibility of DNA extraction at low levels (101 cells/mL) in EDTA whole blood among the four extraction instruments they tested [3]. The same can be seen in parasitic infections, demonstrated by Yera et al., which showed that DNA extraction procedures led to variations in detecting low concentrations of Toxoplasma gondii tachyzoites in amniotic fluid samples, a difference that could affect early diagnosis of congenital toxoplasmosis [4].
Other studies have evaluated extraction systems for human immunodeficiency virus (HIV) [5–8], hepatitis B virus (HBV) [9, 10], Cytomegalovirus (CMV) [11], enterovirus [12], norovirus [13], and HSV [14]. Essentially all published extraction comparison studies have seen quantitative differences in results across the different systems evaluated, sometimes with quantitative differences significantly more than 1 log.
Cell-free DNA measurements
Another level of complexity is added when the size of the nucleic acid to be isolated varies. It is known that nucleic acids fragment during the extraction process, but recent studies have demonstrated that nucleic acids may be a variety of sizes in the initial sample, especially in blood. Cell-free circulating DNA (cfDNA) in blood coming from cellular breakdown was first described by Mandel and Metais in 1948 [15]. The size of cfDNA fragments described is approximately 167 bp, equivalent to the size of chromatosome DNA and similar to post-apoptosis DNA fragments. In the last 20 years, there has been increased interest in measuring and quantifying cfDNA in a variety of cancers. Key observations from these studies are: (1) The concentration in plasma/serum is very low, 10–100 ng/mL. Thus, many studies have focused on identifying extraction methods to maximize cfDNA yield. (2) Sample collection tubes with cell-stabilizing reagents to prevent contamination of plasma with cellular DNA can increase the purity and yield of cfDNA. (3) Use of generic DNA extraction methods can cause further fragmentation of cfDNA and decrease yields compared to cfDNA-specific extraction methods. Recently, extraction instrument manufacturers have introduced cfDNA isolation kits and instruments. These kits utilize higher input volumes of 1.0–5.0 mL, and optimized temperatures or buffer conditions to improve yields. cfDNA kits from several manufacturers have been shown to have better performance in several studies. Four excellent reviews describing the technical aspects of cfDNA extraction and comparison of cfDNA extraction methods have been published [16–19].
Our DNA fragment extraction study
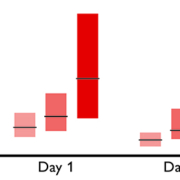
To better understand how DNA fragment size may impact viral infectious disease test results, we designed a study [20] comparing extraction yields for differently sized DNA fragments across 11 commercially available extraction methods commonly used in clinical laboratories, and also compared the performance of four new cfDNA extraction methods. Artificially constructed DNA fragments with sizes ranging from 50 to 1,500 bp were extracted and tested by droplet digital PCR to determine the DNA fragment yield across methods. We found a wide range of extraction yields across both extraction methods and instruments, with the 50 and 100 bp fragment sizes showing especially inconsistent quantitative results and poor yields of less than 20%. Figure 1 shows the yield results of two representative methods and one cfDNA method. Two of the methods designed to extract cfDNA gave the highest yields for the 50 and 100 bp fragments but overall yields were poor. We also observed the lowest variability across methods for the larger sized fragments at higher concentrations. Overall, we saw the most variability for the smallest sized fragments and observed variability dependent on concentration.
Results from our study demonstrate significant differences in fragment extraction yields and overall poor yields of the small artificial DNA fragments even at high concentrations in essentially all routinely used methods. Two of the four cfDNA methods showed improved (although still low) yield of smaller fragments. Further studies are necessary to determine the cause of this significant difference in yields. We speculate as the field moves toward more next generation sequencing approaches, these differences in extraction efficiency and quantification of small cfDNAs will become more widely described.
A critical next step is to determine if viral cfDNA exists in patients with a variety of infectious diseases and if their measurement has clinical relevance. Further studies should focus on identifying which viruses or other infectious agents have cfDNA and then methods to extract and evaluate this cfDNA must be significantly improved. To date, only cfDNA associated with Epstein-Barr virus (EBV) has been extensively studied and hints of cfDNA importance in CMV disease have been seen.
cfDNA in EBV
As early as 2003, Chan et al. described the differential detection of EBV by PCR depending on the size of the PCR amplicon, demonstrating that an assay with an 82 bp amplicon detected 7.5 times more EBV in plasma that a 181 bp amplicon assay [21]. Many additional studies in nasopharyngeal carcinoma have confirmed the excellent utility of measuring the quantity of this small EBV-associated cfDNA for monitoring of therapy response, prediction of recurrence, and monitoring at-risk populations.
Two recent large studies have shown that plasma levels of EBV are the most useful sample type for testing EBV infected patients [22, 23] but cfDNA was not specifically identified in these studies. A study by Lit et al. in EBV-associated lymphoma patients demonstrated EBV cfDNA [24] and noted that the subset of patients with ‘active’ disease had a relative predominance of cfDNA compared to predominantly larger cell-associated EBV DNA seen in cases of inactive disease or remission. Thus, measurement of both EBV cfDNA as well as larger EBV DNA fragments may be important in clinical testing and it may be necessary to distinguish the size of EBV in the plasma. Further studies are necessary to determine how useful detection of cfDNA may be in all EBV-associated malignancies and infections.
cfDNA in CMV
Published data hints that fragmented DNA may also be important for CMV PCR quantitation. In one study, Boom et al. fractionated CMV DNA in plasma and whole blood from three renal transplant cases with primary CMV infection and measured the quantities present with two PCR amplicons sized 578 bp and 134 bp [25]. They demonstrated that CMV DNA was predominantly less than 2000 bp and detected many small sized fragments only with the 134 bp amplicon PCR. Habbal et al. also studied 17 different CMV primer sets and demonstrated that the two of the four primer sets with the smallest amplicons (<100 bp) were the most sensitive for detection of cultured CMV strains [26]. Tong et al., found that among 20 solid organ transplant recipients, 10 had exclusively free CMV DNA, while the remaining 10 had predominantly free CMV DNA with a small percentage of encapsulated-virion DNA present [27]. In addition, they compared results for two assays with small amplicon sizes of 81 and 138 bp and found a 2.6-fold higher level with the smaller amplicon, suggesting CMV DNA present in these clinical samples was very small (<138 bp). It appears critical to use a high-yield small CMV DNA fragment extraction method as well as a small CMV PCR amplicon assay to maximize CMV detection of CMV. Incorporating these two elements into clinical CMV PCR assays could decrease assay variability and decrease inter-lab variability.
cfDNA in other viruses
There is evidence that cfDNA may be useful in infections and malignancies associated with viruses other than EBV and CMV. A recent study by Chesnais et al. mimicked detection of genetic mutations in pre-term children by using CCF from maternal plasma and demonstrated the potential of this technology to detect multiple viruses present in low levels in mothers or pre-term babies [28]. In addition, case reports for Kaposi’s sarcoma and BKPyV-associated bladder cancer (virus-associated cancers) suggest utility of quantitative measurements of cfDNA containing HHV8 (human herpes virus 8, also known as Kaposi’s sarcoma-associated herpesvirus) or BK virus, respectively, in tumor detection and therapeutic monitoring. Further studies are necessary in these two diseases as well as other infectious diseases to evaluate the clinical utility of cfDNA measurements.
References
1. McCulloch E, Ramage G, Jones B, Warn P, Kirkpatrick WR, Patterson TF, et al. Don’t throw your blood clots away: use of blood clot may improve sensitivity of PCR diagnosis in invasive aspergillosis. J Clin Pathol 2009; 62(6): 539–541.
2. Claassen S, du Toit E, Kaba M, Moodley C, Zar HJ, Nicol MP. A comparison of the efficiency of five different commercial DNA extraction kits for extraction of DNA from faecal samples. J Microbiol Methods 2013; 94(2): 103–110.
3. Perry MD, White PL, Barnes RA. Comparison of four automated nucleic acid extraction platforms for the recovery of DNA from Aspergillus fumigatus. J Med Microbiol 2014; 63(Pt 9): 1160–1166.
4. Yera H, Filisetti D, Bastien P, Ancelle T, Thulliez P, Delhaes L. Multicenter comparative evaluation of five commercial methods for toxoplasma DNA extraction from amniotic fluid. J Clin Microbiol 2009; 47(12): 3881–3886.
5. Cornelissen M, Gall A, Vink M, Zorgdrager F, Binter S, Edwards S, et al. From clinical sample to complete genome: comparing methods for the extraction of HIV-1 RNA for high-throughput deep sequencing. Virus Res 2017; 239: 10–16.
6. Alp A, Hascelik G. Comparison of 3 nucleic acid isolation methods for the quantification of HIV-1 RNA by Cobas Taqman real-time polymerase chain reaction system. Diagn Microbiol Infect Dis 2009; 63(4): 365–371.
7. Stevens W, Horsfield P, Scott LE. Evaluation of the performance of the automated NucliSENS easyMAG and EasyQ systems versus the Roche AmpliPrep-AMPLICOR combination for high-throughput monitoring of human immunodeficiency virus load. J Clin Microbiol 2007; 45(4): 1244–1249.
8. Swanson P, Holzmayer V, Huang S, Hay P, Adebiyi A, Rice P, et al. Performance of the automated Abbott RealTime HIV-1 assay on a genetically diverse panel of specimens from London: comparison to VERSANT HIV-1 RNA 3.0, AMPLICOR HIV-1 MONITOR v1.5, and LCx HIV RNA Quantitative assays. J Virol Methods 2006; 137(2): 184–192.
9. Kang SH, Lee EH, Park G, Jang SJ, Moon DS. Comparison of MagNA Pure 96, Chemagic MSM1, and QIAamp MinElute for hepatitis B virus nucleic acid extraction. Ann Clin Lab Sci 2012; 42(4): 370–374.
10. Pyne MT, Vest L, Clement J, Lee J, Rosvall JR, Luk K, et al. Comparison of three Roche hepatitis B virus viral load assay formats. J Clin Microbiol 2012; 50(7): 2337–2342.
11. Bravo D, Clari MA, Costa E, Munoz-Cobo B, Solano C, Jose Remigia M, et al. Comparative evaluation of three automated systems for DNA extraction in conjunction with three commercially available real-time PCR assays for quantitation of plasma Cytomegalovirus DNAemia in allogeneic stem cell transplant recipients. J Clin Microbiol 2011; 49(8): 2899–2904.
12. Shulman LM, Hindiyeh M, Muhsen K, Cohen D, Mendelson E, Sofer D. Evaluation of four different systems for extraction of RNA from stool suspensions using MS-2 coliphage as an exogenous control for RT-PCR inhibition. PLoS One 2012; 7(7): e39455.
13. Verheyen J, Kaiser R, Bozic M, Timmen-Wego M, Maier BK, Kessler HH. Extraction of viral nucleic acids: comparison of five automated nucleic acid extraction platforms. J Clin Virol 2012; 54(3): 255–259.
14. Espy MJ, Rys PN, Wold AD, Uhl JR, Sloan LM, Jenkins GD, et al. Detection of herpes simplex virus DNA in genital and dermal specimens by LightCycler PCR after extraction using the IsoQuick, MagNA Pure, and BioRobot 9604 methods. J Clin Microbiol 2001; 39(6): 2233–2236.
15. Mandel P, Metais P. Les acides nucleiques du plasma sanguin chez l’homme. C R Seances Soc Biol Fil 1948; 142(3–4): 241–243 (in French).
16. Devonshire AS, Whale AS, Gutteridge A, Jones G, Cowen S, Foy CA, et al. Towards standardisation of cell-free DNA measurement in plasma: controls for extraction efficiency, fragment size bias and quantification. Anal Bioanal Chem 2014; 406(26): 6499–6512.
17. Fong SL, Zhang JT, Lim CK, Eu KW, Liu Y. Comparison of 7 methods for extracting cell-free DNA from serum samples of colorectal cancer patients. Clin Chem 2009; 55(3): 587–589.
18. Perez-Barrios C, Nieto-Alcolado I, Torrente M, Jimenez-Sanchez C, Calvo V, Gutierrez-Sanz L, et al. Comparison of methods for circulating cell-free DNA isolation using blood from cancer patients: impact on biomarker testing. Transl Lung Cancer Res 2016; 5(6): 665–672.
19. Sorber L, Zwaenepoel K, Deschoolmeester V, Roeyen G, Lardon F, Rolfo C, et al. A comparison of cell-free DNA isolation kits: isolation and quantification of cell-free DNA in plasma. J Mol Diagn 2017; 19(1): 162–168.
20. Cook L, Starr K, Boonyaratanakornkit J, Hayden R, Caliendo AM. Does size matter? Comparison of extraction yield for different-sized DNA fragments by 7 different routine and 4 new circulating cell-free extraction methods. J Clin Microbiol 2018; 56(12): pii: e01061-18.
21. Chan KC, Zhang J, Chan AT, Lei KI, Leung SF, Chan LY, et al. Molecular characterization of circulating EBV DNA in the plasma of nasopharyngeal carcinoma and lymphoma patients. Cancer Res 2003; 63(9): 2028–2032.
22. Ruf S, Behnke-Hall K, Gruhn B, Bauer J, Horn M, Beck J, et al. Comparison of six different specimen types for Epstein-Barr viral load quantification in peripheral blood of pediatric patients after heart transplantation or after allogeneic hematopoietic stem cell transplantation. J Clin Virol 2012; 53(3): 186–194.
23. Kanakry JA, Hegde AM, Durand CM, Massie AB, Greer AE, Ambinder RF, et al. The clinical significance of EBV DNA in the plasma and peripheral blood mononuclear cells of patients with or without EBV diseases. Blood 2016; 127(16): 2007–2017.
24. Lit LC, Chan KC, Leung SF, Lei KI, Chan LY, Chow KC, et al. Distribution of cell-free and cell-associated Epstein-Barr virus (EBV) DNA in the blood of patients with nasopharyngeal carcinoma and EBV-associated lymphoma. Clin Chem 2004; 50(10): 1842–1845.
25. Boom R, Sol CJ, Schuurman T, Van Breda A, Weel JF, Beld M, et al. Human cytomegalovirus DNA in plasma and serum specimens of renal transplant recipients is highly fragmented. J Clin Microbiol 2002; 40(11): 4105–4113.
26. Habbal W, Monem F, Gartner BC. Comparative evaluation of published cytomegalovirus primers for rapid real-time PCR: which are the most sensitive? J Med Microbiol 2009; 58(Pt 7): 878–883.
27. Tong Y, Pang XL, Mabilangan C, Preiksaitis JK. Determination of the biological form of human cytomegalovirus DNA in the plasma of solid-organ transplant recipients. J Infect Dis 2017; 215(7): 1094–1101.
28. Chesnais V, Ott A, Chaplais E, Gabillard S, Pallares D, Vauloup-Fellous C, et al. Using massively parallel shotgun sequencing of maternal plasmatic cell-free DNA for cytomegalovirus DNA detection during pregnancy: a proof of concept study. Sci Rep 2018; 8(1): 4321.
The authors
Kimberly Starr1 PhD and Linda Cook*2,3 PhD, D(ABMLI)
1Clinical Microbiology Division, Department of Laboratory Medicine, University of Washington Medicine, Seattle, WA, USA
2Clinical Virology Division, Department of Laboratory Medicine, University of Washington Medicine, Seattle, WA, USA
3Vaccine and Infectious Diseases Division, Fred Hutchinson Cancer Research Center, Seattle, WA, USA
*Corresponding author
E-mail: lincook@uw.edu
The global eradication of malaria is a challenging, although perhaps not impossible, aim: Paraguay was recently declared malaria-free and, according to the World Health Organization, Algeria, Argentina and Uzbekistan are likely to be declared malaria free by the end of the year. Several tactics are being used to prevent infection, including preventing mosquito bites by sleeping under insecticide-soaked nets, spraying and draining standing water to control mosquito numbers, and CRISPR techniques to generate malaria-resistant mosquitos are being tested. A number of antimalarial medications are available for treating infection and it is advised that malaria infection is confirmed before starting treatment in order to limit the spread of drug resistance. Early and accurate diagnosis of malaria is essential for the best treatment outcomes and diagnosis can be achieved in several ways. Microscopy is the gold standard, but requires trained and experienced personnel, takes days and can still be inadequate and inaccessible in many remote/poor areas. PCR is another lab-based technique that allows detection and identification of the Plasmodium species and is useful where there is no access to microscopy or the microscopy results are unclear, as well as in cases of mixed infection. However, the cost of these tests is prohibitive in many regions with endemic malaria. Rapid diagnostic tests, using finger-prick blood samples, are specifically designed for use in remote, poor areas, detect malaria antigens and provide results within 30 minutes. One difficulty, however, is the identification and treatment of the small number of infected but symptomless carriers of the disease, who, if left untreated, can provide a continuing source of infection. According to research presented recently at the annual meeting of the American Association of Tropical Medicine & Hygiene, we might soon have a fast and non-invasive way of detecting these symptomless carriers. People infected with malaria give off an aroma that is imperceptible to humans but is very attractive to mosquitos. A pilot study by Steve Lindsay at Durham University and colleagues has shown that it is possible to train dogs to detect the same aroma and to discriminate between malaria-infected and -uninfected people with a reasonable degree of diagnostic accuracy, recognizing socks worn by children with malaria about 70% of the time and socks worn by uninfected children about 90% of the time. The next stage is to test the dogs with people instead of just socks. If successful, the potential exists to use information learnt from the dogs to create a bioelectronic nose for malaria, in the same way that medical detection dogs are already being used to aid the development of such a device for the detection of cancer.
November 2024
The leading international magazine for Clinical laboratory Equipment for everyone in the Vitro diagnostics
Beukenlaan 137
5616 VD Eindhoven
The Netherlands
+31 85064 55 82
info@clinlabint.com
PanGlobal Media is not responsible for any error or omission that might occur in the electronic display of product or company data.
This site uses cookies. By continuing to browse the site, you are agreeing to our use of cookies.
Accept settingsHide notification onlyCookie settingsWe may ask you to place cookies on your device. We use cookies to let us know when you visit our websites, how you interact with us, to enrich your user experience and to customise your relationship with our website.
Click on the different sections for more information. You can also change some of your preferences. Please note that blocking some types of cookies may affect your experience on our websites and the services we can provide.
These cookies are strictly necessary to provide you with services available through our website and to use some of its features.
Because these cookies are strictly necessary to provide the website, refusing them will affect the functioning of our site. You can always block or delete cookies by changing your browser settings and block all cookies on this website forcibly. But this will always ask you to accept/refuse cookies when you visit our site again.
We fully respect if you want to refuse cookies, but to avoid asking you each time again to kindly allow us to store a cookie for that purpose. You are always free to unsubscribe or other cookies to get a better experience. If you refuse cookies, we will delete all cookies set in our domain.
We provide you with a list of cookies stored on your computer in our domain, so that you can check what we have stored. For security reasons, we cannot display or modify cookies from other domains. You can check these in your browser's security settings.
.These cookies collect information that is used in aggregate form to help us understand how our website is used or how effective our marketing campaigns are, or to help us customise our website and application for you to improve your experience.
If you do not want us to track your visit to our site, you can disable this in your browser here:
.
We also use various external services such as Google Webfonts, Google Maps and external video providers. Since these providers may collect personal data such as your IP address, you can block them here. Please note that this may significantly reduce the functionality and appearance of our site. Changes will only be effective once you reload the page
Google Webfont Settings:
Google Maps Settings:
Google reCaptcha settings:
Vimeo and Youtube videos embedding:
.U kunt meer lezen over onze cookies en privacy-instellingen op onze Privacybeleid-pagina.
Privacy policy