Therapeutic drug monitoring of mycophenolic acid and its glucuronide by HPLC/UV
A simple and rapid method for simultaneous determination of mycophenolic acid (MPA) and its glucuronide (MPAG) in plasma using high-performance liquid chromatography (HPLC) with UV detection is described. MPA is an immunosuppressant used in kidney, liver and heart transplantation to prevent organ rejection. Owing to MPA’s narrow therapeutic window and considerable variability within and between patients, the routine monitoring of MPA concentrations is suggested.
by C. Misch and Prof. P. Tang PhD
Background
Mycophenolate mofetil (MMF) and enteric-coated mycophenolate sodium (EC-MPS) are widely used to prevent organ rejection after organ transplantation. Following administration, both prodrugs are rapidly hydrolysed to mycophenolic acid (MPA), the active immunosuppressant. MPA is able to suppress the synthesis of guanosine nucleotides in T and B lymphocytes, principally via noncompetitive, selective and reversible inhibition of inosine monophosphate dehydrogenase. MPA is primarily metabolized by the uridine diphosphate glucuronyl transferase to an inactive glucuronide (MPAG), which is transported from liver into bile. Biliary MPAG then enters the gastrointestinal (GI) tract, where it is converted back to MPA, which is then recycled into the bloodstream via the enterohepatic circulation pathway. Several studies have documented that variation in MPA plasma concentrations are unpredictable and variability in plasma concentrations of MPA within and between individuals are high [1–4]. The highly variable set of patient situations on MPA therapies can cause variable risk for adverse effects such as hematologic and GI toxicity. Therapeutic drug monitoring (TDM) of MPA and MPAG can aid clinicians develop personalized therapy strategies to avoid toxicity and maintain efficacy.
For measuring MPA and MPAG concentrations in biological samples, high-performance liquid chromatography (HPLC) has been the primary technique. Scrutinizing all reported technologies, mass spectrometry is generally superior in sensitivity, selectivity and specificity to other detectors. However, the purchase, maintenance and running costs of mass spectrometry are high. From an economic standpoint, HPLC/UV methods [5–10] allow cost-effective assay while provide adequate sensitivity, selectivity and specificity for measuring clinically relevant concentrations of MPA (0.5–5 μg/mL) and MPAG (5–100 µg/mL). The intent of this application was to develop a simple and rapid HPLC/UV method for the determination of MPA and MPAG concentrations in plasma.
Experimental details
Apparatus and materials
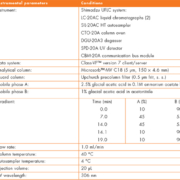
The instrument and analytical conditions are listed in Table 1. MPA and internal standard clonazepam were obtained from Sigma (St. Louis, MO). MPAG was from TRC (Toronto Research Chemicals). All other chemicals used were analytical grade or HPLC grade. Separate stock solutions of clonazepam, MPA and MPAG were prepared by accurately weighing and dissolving it in an appropriate amount of methanol.
Calibration/sample preparation
For constructing calibration curves, the concentration ranges of MPA and MPAG were set to 0.1–20 and 1–200 µg/mL, respectively. To 0.1 mL of blank plasma, 0.1 mL each of clonazepam, MPA, MPAG and methanol were added; the mixture was vortex-mixed for 1 min. After centrifugation for 10 min at 10 000 rpm, the supernatant was transferred to an autosampler vial. To 0.1 mL of patient plasma, 0.1 mL clonazepam and 0.3 mL methanol were added and processed as stated above
Results and discussion
Chromatographic separation
A typical chromatogram is presented in Figure 1. These compounds resolved without any overlapping of their peaks or ambiguity in identification. All compounds were eluted within 14 min. No interference was observed in patient samples containing endogenous matrix components, metabolites, xenobiotics and concomitant medication (see Table 2).
Linearity
Good linearities (1/x weighted) were obtained for MPA and MPAG with coefficient of determination (r2) values >0.990 from 0.1 to 20 µg/mL (for MPA) or 1 to 200 µg/mL (for MPAG). The percentage deviation was <15%.
Method validation
Method accuracy and precision data are presented in Table 3. Overall the percentage recovery of MPA and MPAG ranged from 93 to 105%, indicating the consistent, precise, and reproducible extraction efficiency of the method. Both within-run (n=6) and between-run (n=30) precisions were <9%.
Comparison between two HPLC-UV methods
Figure 2a and 2b illustrate comparisons between the current method and reference method. The reference method was also based on a HPLC-UV procedure. The correlation between the two methods was good; the linear regression statistics indicated both r2 values >0.990 (P<0.0001). The linear regression equation for MPA correlation was y = 1.018 x + 0.031 with a standard error value of 0.24; where y, the current method and x, the reference method. The linear regression equation for MPAG correlation was y = 0.984 x − 0.292 with a standard error value of 5.08.
MPA and MPAG concentrations in plasma
Figure 3 illustrates considerable variability of MPA and MPAG concentrations in patient plasma. MPA concentrations ranged from 0.3 to143 µg/mL; MPAG concentrations ranged from 1.2 to 457 µg/mL; MPAG : MPA mole ratio ranged from 0.5 to 186. The mean values for MPA, MPAG and MPAG : MPA were 9.5 µg/mL, 62.3 µg/mL and 13.5, respectively. Clearly, this assay can aid clinicians develop personalized therapy strategies to avoid toxicity and maintain efficacy.
Conclusion
This method includes single dilution step, protein precipitation, ultracentrifugation and gradient chromatography. Sample preparation is rapid and efficient. This method avoids the use of more complex liquid–liquid extraction or solid-phase extraction procedure, which substantially decreases set-up time. This method has been applied to measure MPA and MPAG concentrations in plasma for pharmacokinetic studies and for monitoring clinical use of MPA prodrugs.
References
1. Bullingham RE, Nicholls AJ, Kamm BR. Clinical pharmacokinetics of mycophenolate mofetil. Clin Pharmacokin. 1998; 34: 429–455.
2. Shaw LM, Korecka M, et al. Mycophenolic acid pharmacodynamics and pharmacokinetics provide a basis for rational monitoring strategies. Am J Transplant. 2003; 3: 534–542.
3. Staatz CE, Tett SE. Clinical pharmacokinetics and pharmacodynamics of mycophenolate in solid organ transplant recipients. Clin Pharmacokinet. 2007; 46:13–58.
4. Cattaneo D, Baldelli S, Perico N. Pharmacogenetics of immunosuppressants: progress, pitfalls and promises. Am J Transplant. 2008; 8: 1374–1383.
5. Indjova D, Kassabova L, Svinarov D. Simultaneous determination of mycophenolic acid and its phenolic glucuronide in human plasma using an isocratic high-performance liquid chromatography procedure. J Chromatogr B Analyt Technol Biomed Life Sci. 2005; 817: 327–330.
6. Patel CG, Akhlaghi F. High-performance liquid chromatography method for the determination of mycophenolic acid and its acyl and phenol glucuronide metabolites in human plasma. Ther Drug Monit. 2006; 28: 116–122.
7. Bahrami G, Mohammadi B. An isocratic high performance liquid chromatographic method for quantification of mycophenolic acid and its glucuronide metabolite in human serum using liquid-liquid extraction: application to human pharmacokinetic studies. Clini Chim Acta. 2006; 370: 185–190.
8. Mino Y, Naito T, et al. Simultaneous determination of mycophenolic acid and its glucuronides in human plasma using isocratic ion pair high-performance liquid chromatography. J Pharm Biomed Anal. 2008; 46: 603–608.
9. Watson DG, Araya FG, et al. Development of a high pressure liquid chromatography method for the determination of mycophenolic acid and its glucuronide metabolite in small volumes of plasma from paediatric patients. J Pharm Biomed Anal. 2004; 35: 87–92.
10. Westley IS, Sallustio BC, Morris RG. Validation of a high-performance liquid chromatography method for the measurement of mycophenolic acid and its glucuronide metabolites in plasma. Clin Biochem. 2005; 38: 824–829.
The authors
Catherine Misch MLT and Peter Tang* PhD
Department of Pathology and Laboratory Medicine, Cincinnati Children’s Hospital Medical Center, University of Cincinnati College of Medicine, Cincinnati, Ohio, USA
*Corresponding author
E-mail: peter.tang@cchmc.org


