Two common peak-integration protocols for the quantification of M-proteins in serum protein electrophoresis
Quantification of M-proteins plays an important role in diagnosing and managing patients with monoclonal gammopathies. This is traditionally performed by integrating abnormal monoclonal peaks in the electrophoretogram, using either a perpendicular drop (PD) or tangential skim (TS) method. In this article, we describe the advantages and disadvantages of the PD and TS integration methods and outline potential clinical aspects that should be considered when choosing the integration method.
Introduction
Plasma cells are mature antibody-producing cells that reside in the bone marrow. They are derived from B lymphocytes and are activated when their B-cell receptor binds to either soluble or membrane-bound antigens [1]. Monoclonal gammopathies (MGs) encompass a group of disorders wherein an abnormally expanded plasma cell clone or lymphocytic cells proliferate, resulting in the secretion of a characteristic monoclonal immunoglobulin, commonly referred to as a paraprotein or M-protein. MGs can range from relatively stable and asymptomatic conditions such as monoclonal gammopathy of undetermined significance (MGUS) and smouldering multiple myeloma, to overt and progressive diseases such as multiple myeloma (MM), Waldenström macroglobulinemia, light chain amyloidosis, and non-Hodgkin lymphomas [2]. The prevalence of MGs increases with age, with a prevalence of approximately 3% in the general population above 50 years of age. The median age at diagnosis is 65–70 years.
Laboratory investigation of MGs
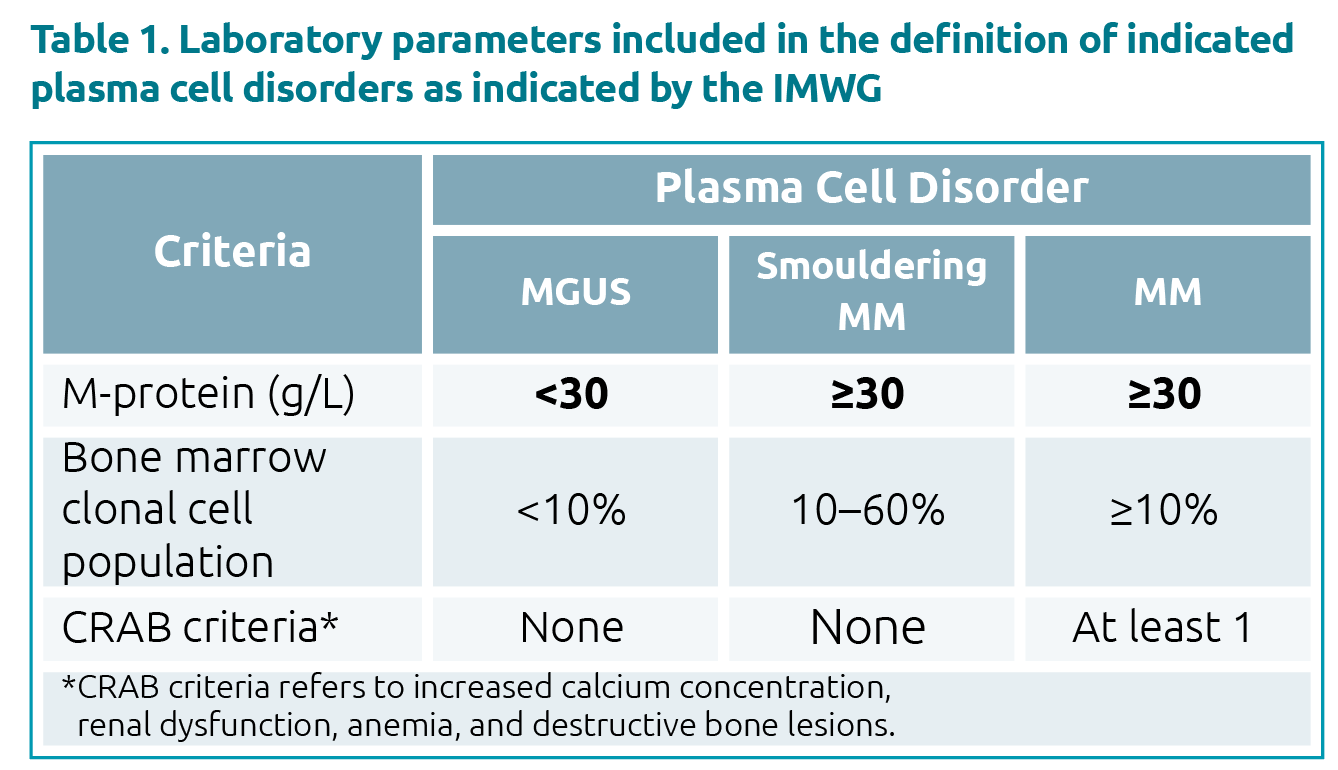
Laboratory investigations are an important part of the work-up for a patient with a suspected MG, aiding not only in diagnosis, but in monitoring and risk prognostication as well. The International Myeloma Working Group guidelines differentiate MM from asymptomatic conditions such as MGUS and smouldering MM by the presence of end-organ damage known as the CRAB criteria, which include increased calcium concentration, renal dysfunction, anemia, and destructive bone lesions [3]. Additional definitive parameters include the bone marrow clonal cell population, and the M-protein concentration (Table 1). The latter is also used frequently to assess prognosis and monitor treatment response in patients with MGs. In MGUS, M-protein levels ≥15 g/L are considered to be high risk for progression to malignant diseases. In patients with MM undergoing treatment, a 25% decrease in M-protein concentration is considered as a minimal response, whereas a 50% decrease as partial, and a decrease of 90% or more as a very good partial response. A measurable disease is defined as having an M-protein ≥10 g/L for serum and/or an M-protein excretion in urine of ≥200 mg/24 hours, and that it should be tracked by changes in M-protein concentration.
Common biochemistry tests for the investigations of MGs include serum protein electrophoresis (SPE), serum immunofixation electrophoresis (IFE), urine protein electrophoresis (UPE), urine immunofixation electrophoresis (uIFE), and serum free light chain (sFLC) assays. Both the electrophoresis and sFLC assays provide estimates of the M-protein concentrations. This article, however, will focus only on the quantification of M-proteins in SPE; how integration methods differ and their advantages/disadvantages, as well as the potential clinical impact when choosing one integration method over the other.
Serum protein electrophoresis (SPE)
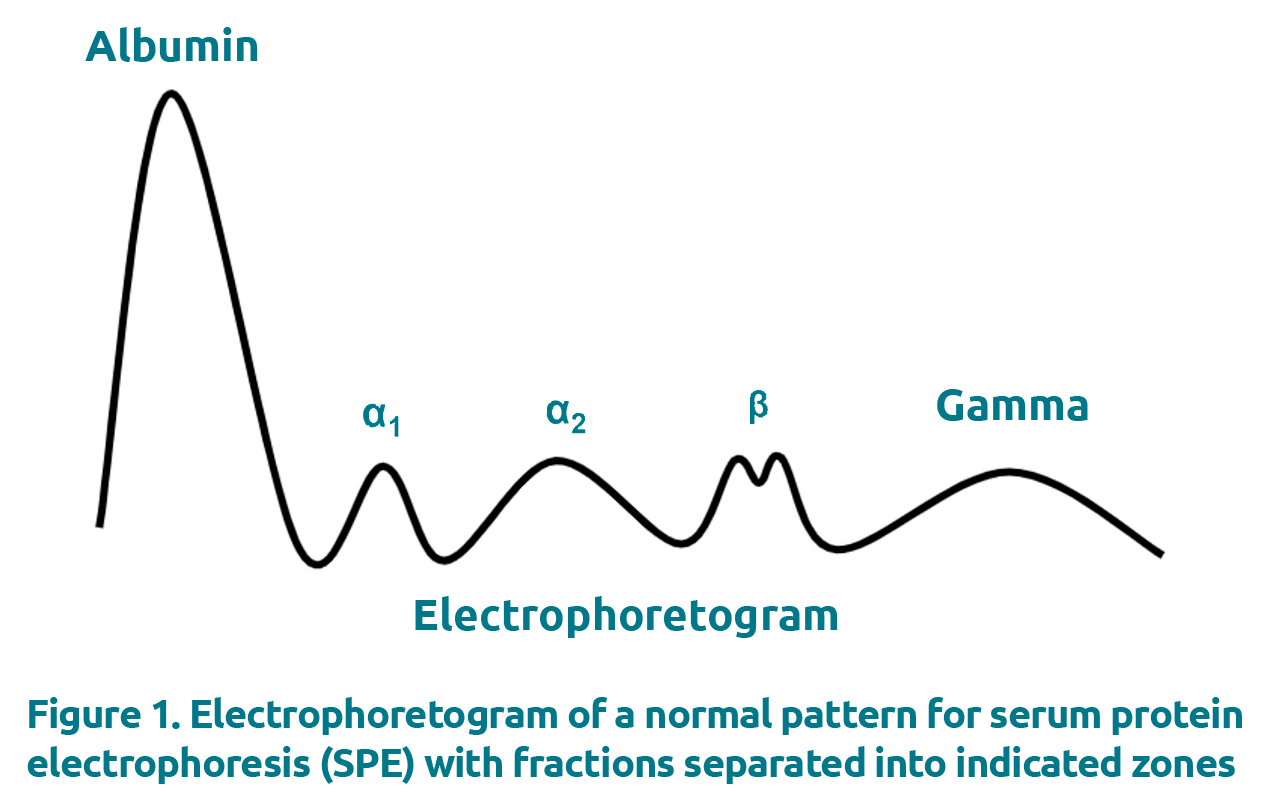
SPE is commonly performed using either agarose gel electrophoresis (AGE) or capillary electrophoresis (CZE). These techniques employ different methodologies to separate the individual proteins: AGE makes use of a gel support and separates proteins through a combination of the gel porosity, the buffer (net charge on proteins) and the electric field, whereas in CZE, capillary columns composed of fused silica generate electro-osmotic flow to separate individual proteins. The output, however, is the same, wherein the generated electrophoretogram displays the proteins separated into 5–6 major zones, namely albumin, alpha-1, alpha-2, beta (which can be total beta or beta-1 and beta-2 depending on resolution) and gamma (Fig. 1). M-proteins present as abnormal bands in the electrophoretogram, most commonly in the gamma region, although they can also appear in beta and alpha-2 regions.
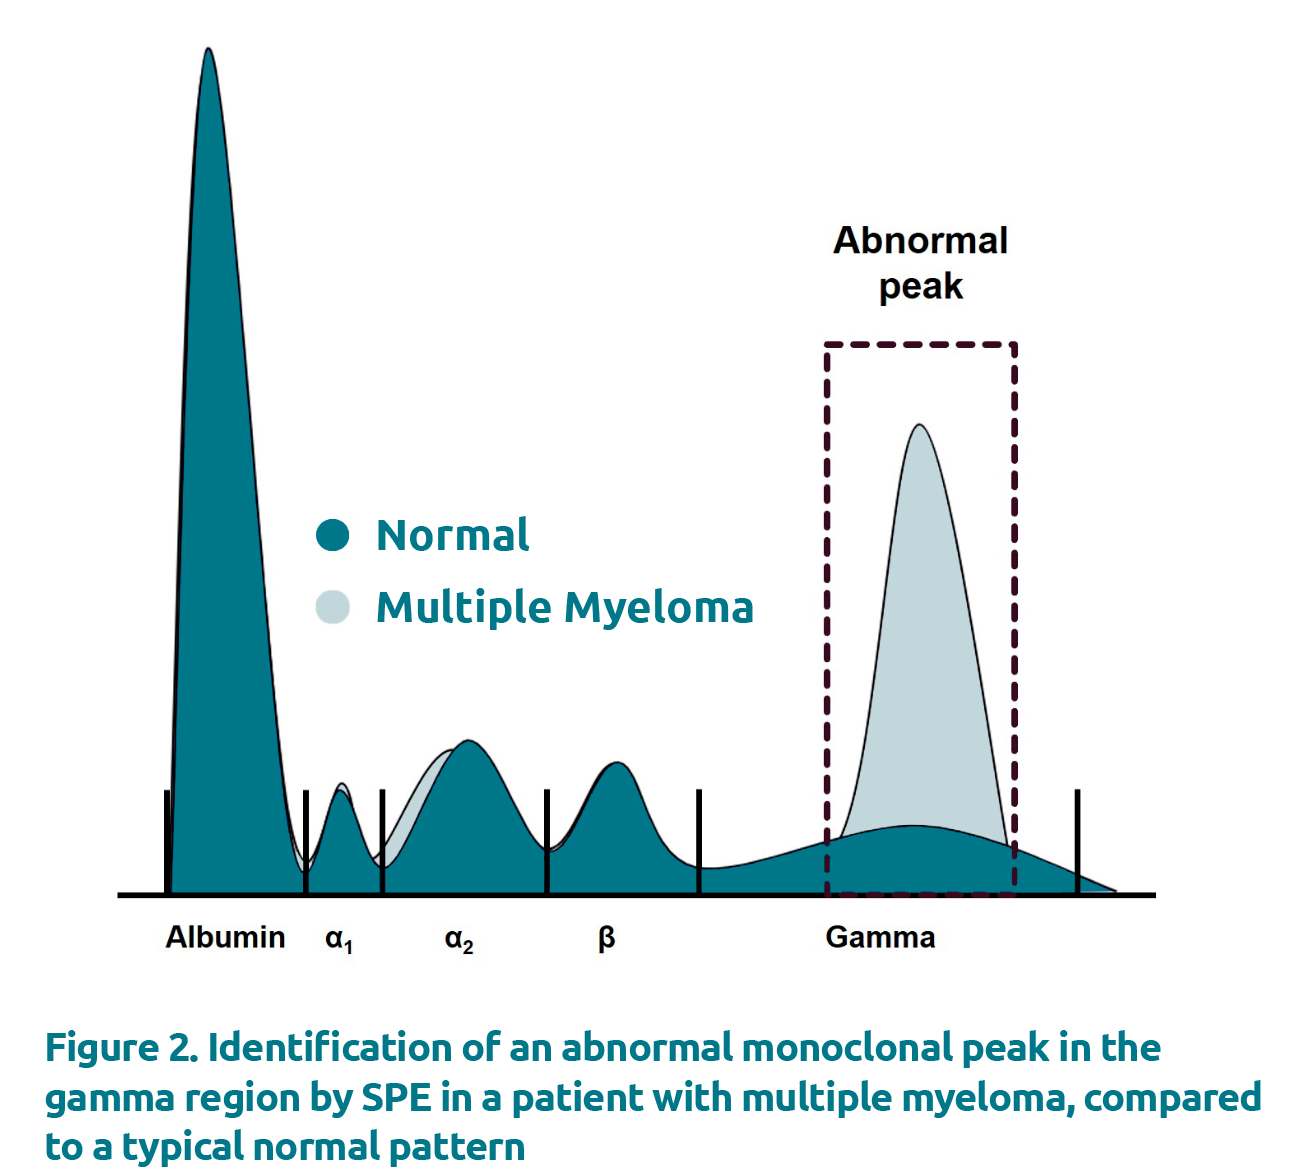
Under physiological conditions, proteins in the gamma region generate a broad and diffuse peak, attributed to polyclonal immunoglobulins. Polyclonal immunoglobulins are a hetero-geneous mixture of immunoglobulins secreted from multiple plasma cell clones. The concentration of polyclonal immuno-globulins can be increased in a number of conditions including inflammatory conditions, infections, and liver disease for examples [4]. In such cases, the representative peak in the gamma region would be increased but, however, would still remain broad and diffuse. In contrast, monoclonal immuno-globulins arise from the overproduction of a single plasma cell clone, leading to a restricted area of migration in the electro-phoretogram that can be gated and quantified (Fig. 2).
Integration by perpendicular drop (PD) versus tangential skim (TS)
The monoclonal concentration can be determined by integrating the M-protein following SPE. The two integration methods commonly used are the perpendicular drop (PD) method and
the tangential skim (TS) method.
PD
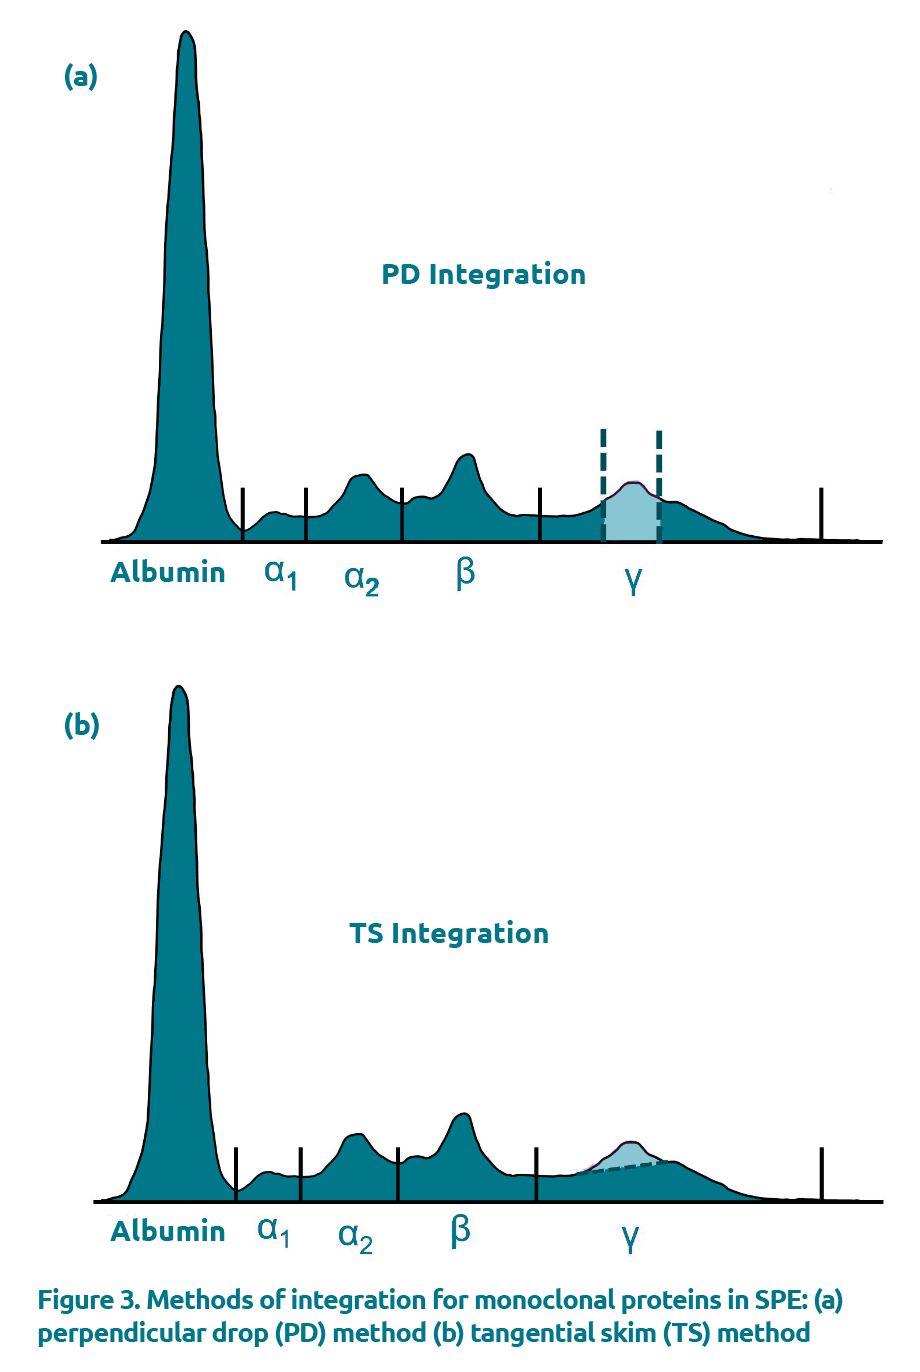
The PD method is the earliest integration method introduced into clinical practice and involves placing vertical gates at both the anodal and cathodal limits of the M-protein and integrating the total area under the curve (Fig. 3a). This method integrates the M-protein down to the baseline and includes any background proteins present, which are mostly polyclonal immunoglobulins in the gamma region but may include other serum proteins as well [5]. Several studies have shown that the PD integration method overestimates M-proteins at concentrations below 10–20 g/L by as much as 82% [6,11]. Although it is generally stated that the minimum concentration for quantification is 1 g/L, it is accepted that quantification of M-proteins at this concentration is both inaccurate and imprecise. Some studies suggest that the M-protein should account for at least 1/4 to 1/3 of the underlying polyclonal base upon visual inspection for reliable integration with PD [7].
TS
An alternative integration method, TS, was first described in 2008 by Schild and colleagues [6]. This integration method involves drawing a line that connects the M-protein anodal and cathodal inflection points and discards the area below the gated peak representing the M-protein (Fig. 3b). This integration method reduces overestimation by excluding the background proteins by drawing a tangential line that separates the monoclonal from the background proteins. By excluding polyclonal immunoglobulins, the TS integration method is reported to improve the accuracy of M-protein quantification over PD by as much as 10-fold [8]. Although spiking studies have shown that the TS integration method can underestimate the monoclonal fraction, the negative bias reported is constant in contrast to the proportional positive bias observed with PD and is less susceptible to changes in polyclonal immunoglobulin concentration [9]. Further, Schild and co-workers demonstrated that dilutions of known M-protein concentrations were linear down to 1.5 g/L by TS, compared to only 15 g/L by PD. However, despite its enhanced accuracy, TS has been poorly adopted and PD remains the integration method of choice for most laboratories [10].
Limitations and accuracy of the methods
A particular limitation of the TS integration method is its decreased precision in comparison to PD. Small changes in the location selected to place the demarcation for integration of a specific M-protein can yield large differences in the resulting concentration. Although this is true for both PD and TS integration methods, the TS method appears to be more susceptible to intra-laboratory and inter-laboratory variability. Causes are plenty but cannot exclude operators being unfamiliar with the technique in these studies as well as an amplified coefficient of variation (CV) caused by a lower mean concentration intrinsically associated with TS.
A study by Willrich and co-workers quantified this difference by assessing SPE limitations and variability across 16 laboratories using the same subset of samples [9]. Among the parameters that had a significant negative impact on intralaboratory variation were low M-protein concentration and using TS to integrate the M-protein; the mean percentage CV for M-proteins ranging from
1 to 10 g/L was significantly higher when using TS compared to PD. The counterpoint to the observation, though, is that PD has not been shown to be linear at concentrations <10 g/L. Thus, the significance of this reduced precision with TS should be interpreted with caution. Another notable limitation to both integration methods is that neither method can reliably quantify M-proteins migrating in the beta region due to non-immunoglobulin interference such as transferrin and C3.
The overestimation of M-protein quantification by PD is largely attributed to inclusion of polyclonal proteins. By the time a diagnosis of MM is reached, the M-protein concentration is high (>30 g/L) and typically suppresses the production of normal polyclonal immunoglobulins, thus yielding acceptable results when using the PD integration method [8]. When the amount of polyclonal proteins present is relatively high compared to the M-protein concentration, however, the M-protein concentration can vary significantly depending on the integration method used. This was highlighted in studies investigating the relationship between background proteins (total gamma concentration to M-protein concentration) and the absolute difference between PD and TS integration methods. The results show that the difference in M-protein concentration between the two integration methods increases substantially with increasing polyclonal proteins [11]. On one platform studied, M-proteins at ≥15 g/L are overestimated by PD by 31% (range, 13–56%), whereas at <15 g/L, the overest-imation is much greater and varied, with an average percentage difference of 82% (range, 27–175%) [11].
The importance of the accuracy of M-protein quantification is best appreciated when comparing two situations when monitoring disease activities with modest-sized and small M-proteins, for example, in patients with MGUS and patients with MM following active treatment. In both scenarios, the presence of significant co-migrating polyclonal immunoglobulins relative to their M-protein size (accounting for the overestimation by PD) may not impact significantly on clinical decision or diagnostic levels due to a relatively large reference change value (RCV) allowed for M-protein. In MGUS, when the polyclonal immunoglobulin concentration is relatively stable, there is little effect on the estimation of the change of M-protein which reflects disease activity. However, in MM following active treatment, the changes in the concentration of polyclonal immunoglobulins can be high and variable, for example chemo-therapy can suppress the production of normal polyclonal immunoglobulins while following stem cell transplant, polyclonal immunoglobulins can often increase indicating the growth and development of the transplanted cells. In MM, a change in the polyclonal immunoglobulin concentration following treatment can cause tremendous clinical confusion over disease activity if an M-protein integration method such as PD (which is susceptible to interferences of polyclonal immunoglobulin) is used to estimate the M-protein concentrations. Therefore, it is important to note that the clinical impact on which M-protein quantification method to use may be dependent on individual laboratories and their respective patient population – those serving populations with primarily MGUS and stable patients or patients undergoing active treatment, whereby the concentration of polyclonal immunoglobulins can be highly variable [11]. As a result, laboratories need to carefully consider their patient population, the clinical impact of increased accuracy versus precision, and whether integration by PD is acceptable or if TS is more appropriate.
Concluding remarks
Quantification of the M-protein levels is an important aspect of managing patients with MGs and is typically performed by integrating the abnormal monoclonal peak in the electrophoretogram either by PD or TS. Both methods have distinct advantages and disadvantages. While laboratories should not switch from one method to another when following a patient, laboratories should consider their patient population and select the most appropriate integration method and use it consistently. Lastly, looking to overcome the limitations of both PD and TS integration methods, emerging studies using mass spectrometry for the evaluation of monoclonal proteins have shown promising results and may be adopted by clinical laboratories in the future [12].
The authors
Jessica Miller1 PhD, Jennifer Taher2 PhD and Pak Cheung Chan*3 PhD
1 Department of Laboratory Medicine & Pathobiology, University of Toronto, Toronto, Ontario, Canada
2 Department of Pathology and Laboratory Medicine, Mount Sinai Hospital, Toronto, Ontario, Canada
3 Division of Clinical Biochemistry, Department of Laboratory Medicine and Molecular Diagnostics, Sunnybrook Health Sciences Centre, Toronto, Ontario, Canada
*Corresponding author
E-mail: pc.chan@sunnybrook.ca
References
1. Fermand JP, Bridoux F, Dispenzieri A et al. Monoclonal gammopathy of clinical significance: a novel concept with therapeutic implications. Blood 2018;132(14):1478–1485
(https://ashpublications.org/blood/article/132/14/1478/39337/Monoclonal-gammopathy-of-clinical-significance-a).
2. Rajkumar SV, Dispenzieri A, Kyle RA. Monoclonal gammopathy of undetermined significance, Waldenström macroglobulinemia, AL amyloidosis, and related plasma cell disorders: diagnosis and treatment. Mayo Clin Proc 2006;81(5):693–703.
3. Dispenzieri A, Kyle R, Merlini G et al. International Myeloma Working Group guidelines for serum-free light chain analysis in multiple myeloma and related disorders. Leukemia 2009;23(2):215–224.
4. O’Connell TX, Horita TJ, Kasravi B. Understanding and interpreting serum protein electrophoresis. Am Fam Physician 2005;71(1):105–112 (https://www.aafp.org/afp/2005/0101/p105.html).
5. Bergón E, Miranda I, Miravalles E. Linearity and detection limit in the measurement of serum M-protein with the capillary zone electrophoresis system Capillarys. Clin Chem Lab Med 2005;43(7):721–723.
6. Schild C, Wermuth B, Trapp-Chiappini D, Egger F, Nuoffer JM. Reliability of M protein quantification: comparison of two peak integration methods on Capillarys 2. Clin Chem Lab Med 2008;46(6):876–877.
7. Katzman JA, Keren DF. Strategy for detecting and following monoclonal gammopathies. In: Detrick B, Schmitz JL, Hamilton RG (eds) Manual of molecular and clinical laboratory immunology, Ch 11, 8th edn. ASM Press 2016. ISBN 978-1555818715.
8. Keren DF, Schroeder L. Challenges of measuring monoclonal proteins in serum. Clin Chem Lab Med 2016;54(6):947–961 (https://www.degruyter.com/document/doi/10.1515/cclm-2015-0862/html).
9. Turner KA, Frinack JL, Ettore MW et al. An international multi-center serum protein electrophoresis accuracy and M-protein isotyping study. Part I: factors impacting limit of quantitation of serum protein electrophoresis. Clin Chem Lab Med 2020;58(4):533–546 (https://www.degruyter.com/document/doi/10.1515/cclm-2019-1104/html).
10. Wijeratne N, Tate JR, Wienholt L, Mollee P. Report of the survey conducted by RCPAQAP on current practice for paraprotein and serum free light chain measurement and reporting: a need for harmonisation. Clin Biochem Rev 2019;40(1):31–42
(https://www.ncbi.nlm.nih.gov/pmc/articles/PMC6370284/).
11. Miller JJ, Taher J, Kulasingam V, Chan PC. To skim or splice? Comparing the quantification of M-proteins using two peak-integration protocols across multiple electrophoresis platforms. Clin Biochem 2022;102:44–49
(https://doi.org/10.1016/j.clinbiochem.2022.01.007).
12. Dasari S, Kohlhagen MC, Dispenzieri A et al. Detection of plasma cell disorders by mass spectrometry: a comprehensive review of 19,523 cases. Mayo Clin Proc 2022;97(2):294–307 (https://www.mayoclinicproceedings.org/article/S0025-6196(21)00652-2/fulltext).


