Beukenlaan 137
5616 VD Eindhoven
The Netherlands
+31 85064 55 82
info@clinlabint.com
PanGlobal Media is not responsible for any error or omission that might occur in the electronic display of product or company data.
Vitamin D status is currently assessed by measurements of total 25-hydroxyvitamin D [25(OH)D]. However, over 99% of circulating 25(OH)D is bound to protein, vitamin D binding protein in particular. The free hormone hypothesis stipulates that only the free form crosses the cell membrane to exert biologic action. Measurement of free 25(OH)D is now available.
by Professor Daniel D Bikle
Introduction
Circulating levels of 25-hydroxyvitamin D [25(OH)D] are the most commonly used marker for the assessment of vitamin D nutritional status. This is because its concentration in blood is higher than all other vitamin D metabolites, making it easier to measure, and because its conversion from vitamin D is substrate dependent with minimal regulation. However, 25(OH)D is not the most biologically active metabolite of vitamin D. Instead 25(OH)D must be further metabolized to 1,25 dihydroxyvitamin D [1,25(OH)2D] for vitamin D to achieve its full biologic potential. 1,25(OH)2D is the ligand for a nuclear transcription factor, the vitamin D receptor (VDR), that mediates the genomic and at least some of the nongenomic actions of vitamin D within the cell. Nearly all, if not all, cells express the VDR at some stage in their development or activation. As the appreciation that vitamin D and its metabolites affect numerous physiologic processes and not just bone and mineral metabolism, and that these physiologic processes may have different requirements for these vitamin D metabolites, interest in determining optimal levels of the vitamin D metabolites to effect these different biologic processes has grown. Complicating this determination is the fact that all the vitamin D metabolites circulate in blood tightly bound to proteins, of which the vitamin D binding protein (DBP) plays the major role. For most cells, these binding proteins limit the flux of the vitamin D metabolites from blood into the cell where they exert their biologic activity. This raises the issue of what should we measure to determine vitamin D status: the total levels of these metabolites or their free levels?
The free hormone hypothesis: why measure free 25(OH)D
The free hormone hypothesis postulates that only the non-bound fraction (the free fraction) of hormones that otherwise circulate in blood bound to their carrier proteins is able to enter cells and exert their biologic effects. This hypothesis applies to steroid hormones, thyroid hormone and vitamin D. For the vitamin D metabolites this hypothesis needs to be qualified in that some tissues, kidney and parathyroid glands in particular, express a transport system, the megalin/cubilin complex, that enables 25(OH)D bound to DBP to be transported into these cells. However, for cells lacking this complex the free fraction is felt to be the fraction capable of entering these cells. In serum samples from normal individuals, ~85% of circulating vitamin D metabolites are bound to DBP, whereas albumin with its substantially lower binding affinity binds only ~15% of these metabolites despite its 10-fold higher concentration than DBP. Approximately 0.4% of total 1,25(OH)2D and 0.02–0.03% of total 25(OH)D is free in serum from normal non-pregnant individuals. The fraction of ‘bioavailable’ vitamin D metabolites is composed of the fraction of the free vitamin D and the fraction bound to albumin, thus measuring around 15% in normal individuals. At this point there is little evidence that the albumin fraction is truly bioavailable. A simple strategy might be to estimate the free concentration based on measurements of DBP and total 25(OH)D with known binding constants of DBP for 25(OH)D. This has in fact been done, but as subsequent research has documented, this relationship is affected by numerous clinical conditions and the different DBP variants with different affinities for 25(OH)D.
DBP
DBP is a 51–58 kDa multifunctional serum glycoprotein synthesized primarily in the liver. Initially, isoelectric focusing migration patterns identified phenotypic variants termed Group-Specific Component (Gc), the most common of which are Gc1f, Gcs and Gc2. Two common missense point mutations (SNPs) in exon 11 of the DBP gene, rs7041 (G/T single-nucleotide variation) and rs4588 (an A/C single-nucleotide variation), result in the three most common isoforms with amino acid changes at positions 416 and 420: Gc1f (Asp416, Thr420), Gc1s (Glu 416, Thr420), and Gc2 (Asp416, Lys420). Gc2 is the least abundant and Gc1f the most abundant. The distribution of the Gc alleles varies by race. Black and Asian populations are more likely to carry the Gc1f form, whereas the Gc2 form is rare, whereas Whites more frequently express the Gc1s and the Gc2 alleles. Although affinities of these DBP variants for 25(OH)D appear to vary, the rank order remains controversial, and their contribution of total 25(OH)D levels and the relationship between free and total 25(OH)D is modest in comparison to differences influenced by clinical condition. In the absence of disease or pregnancy, DBP levels are relatively constant over time in adults. That said, various substances in the blood such as polyunsaturated fatty acids may alter the affinity of DBP for the vitamin D metabolites, as can various clinical conditions. Liver disease leads to reduced levels of DBP, as do protein-losing nephropathies and acute illness (DBP is an acute phase reactant), whereas DBP levels are elevated during the latter stages of pregnancy. Moreover, various clinical conditions appear to shift the relationship between free and total 25(OH)D seemingly independent of DBP levels or DBP haplotypes. Thus, the measurement of total 25(OH)D may not provide the best assessment of vitamin D status. Calculation of free 25(OH)D from DBP and total 25(OH)D measurements using affinity constants obtained by measurements in normal sera may be inaccurate, at least in some clinical situations. Therefore, direct measurement of free 25(OH)D would appear to offer information about vitamin D nutritional status that at least complements that of total 25(OH)D.
The free 25(OH)D assay
The original free 25(OH)D assay employed centrifugal ultrafiltration. This was a labour- and reagent-intensive assay suitable only for a dedicated research laboratory. However, it sufficed to determine free 25(OH)D levels in a number of patient groups including cirrhotics and pregnant women, providing proof of concept that the free 25(OH)D measurement would add to the assessment of vitamin D nutritional status. This assay has subsequently been superseded by a much simpler method capable of high throughput.
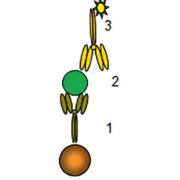
A two-step ELISA that directly measures free 25(OH)D levels was recently developed by Future Diagnostics Solutions using monoclonal antibodies from DIAsource Immunoassays. In the first incubation step, an anti-25(OH)D monoclonal antibody immobilized on a microtitre plate binds the free 25(OH)D in the serum sample. The serum is removed and biotinylated 25(OH)D in a known amount is added to react with the unoccupied binding sites on the monoclonal antibody attached to the plate. The non-bound biotinylated 25(OH)D is then removed followed by the addition of streptavidin peroxidase conjugate and the substrate 3,3ʹ,5,5ʹ-Tetramethylbenzidine (TMB). The bound streptavidin peroxidase can be quantified by measuring the absorbance at 450 nm generated in the reaction. The intensity is inversely proportional to the level of free 25(OH)D. The limit of detection is 2.8 pg/mL. The antibody in the current assay does not recognize 25(OH)D2 as well as 25(OH)D3 (77% of the 25(OH)D3 value), and so it underestimates the free 25(OH)D2. However, under most situations where the predominant vitamin D metabolite is 25(OH)D3 this issue is not a major concern. The data for both normal subjects and those with different DBP levels (cirrhotics, pregnant women) compare quite well to those obtained from similar populations using the centrifugal ultrafiltration assay.
Clinical implications
In a study currently under review for publication we compiled data from over 1600 individuals in whom free 25(OH)D had been measured by this ELISA. The samples included sera from both normal subjects and those with a variety of clinical conditions and a variety of DBP alleles. In the nearly 1000 normal and community dwelling outpatient subjects the normal range for free 25(OH)D was established at 4.3±1.9 pg/mL with a mean total 25(OH)D of 21.9±9.9 ng/mL, providing a percent free 25(OH)D of 0.02%. These results are essentially identical to those reported by the author using centrifugal ultrafiltration 30 years ago. As expected, clinical conditions affecting DBP values made a big difference. Liver disease resulted in lower DBP levels and higher percentage free 25(OH)D resulting in the population of cirrhotics studied having among the highest free 25(OH)D despite the lowest total 25(OH)D. Nursing home patients also had unexpectedly high free 25(OH)D, higher than that of the cirrhotics, with only modest reductions in DBP levels. Pregnancy (third trimester), however, resulted in increased DBP levels and the lowest free 25(OH)D levels, although the free fraction was not lower than that of the normal subjects. Overall, these results indicate that the free fraction is altered by the clinical situation not only in terms of altered DBP levels but in the relationship between total and free 25(OH)D for any given DBP level. Therefore, it is recommended that the free 25(OH)D level needs to be measured directly if the free level is thought to have particular relevance to the clinical situation that cannot be captured by measuring total 25(OH)D.
At this point it is not yet clear whether the determination of free 25(OH)D is a better marker of vitamin D nutritional status and biologic action than the determination of total 25(OH)D. Using a convenient marker such as parathyroid hormone (PTH), much as we use thyroid-stimulating hormone (TSH) as a marker of thyroid status, is problematic. First of all PTH levels are controlled by calcium as well as
vitamin D. Second, regulation of PTH secretion is mediated primarily by the 1,25(OH)2D produced within the gland itself (much as TSH secretion is controlled by triiodothyronine (T3) produced within the pituitary). Third, the parathyroid gland has the megalin/cubilin transport system to enable 25(OH)D bound to DBP to enter the cells, obviating any advantage free 25(OH)D might have in cell uptake. However, several studies have demonstrated a stronger correlation between free 25(OH)D and bone markers than that observed with total 25(OH)D. But at this point, determining the role that free 25(OH)D measurements play in the assessment of vitamin D nutrition and action requires further investigation.
Bibliography
1. Bikle DD. Vitamin D Assays. Front Horm Res 2018; 50: 14–30.
2. Malstroem S, Rejmark L, et al. Current assays to determine free 25-hydroxyvitamin D in serum. J AOAC Internl 2017; 100: 1323–1327.
3. Bikle D, Bouillon R, et al. Vitamin D metabolites in captivity? Should we measure free or total 25(OH)D to assess vitamin D status? J Steroid Biochem Mol Biol 2017; 173: 1054–1116.
4. Bikle DD, Malmstroem S, Schwartz J. Current controversies: are free vitamin metabolite levels a more accurate assessment of vitamin D status than total levels? Endo Clinics NA 2017; 46: 901–918.
5. Lai JC, Bikle DD, et al. Total 25(OH) vitamin D, free 25(OH) vitamin D, and markers of bone turnover in cirrhotics with and without synthetic dysfunction. Liver Int 2015; 35: 2294–2300.
6. Schwartz JB, Lai J, et al. A comparison of direct and calculated free 25-OH vitamin D levels in clinical populations. J Clin Endocrinol Metab 2014; 99: 1631–1637.
The author
Daniel D Bikle MD, PhD
VA Medical Center and University of
California San Francisco, San Francisco,
CA 94158, USA
E-mail: Daniel.bikle@ucsf.edu
Mitochondrial DNA mutations (mtDNA) have been described that are associated with leukemia. To identify somatic mutations it is necessary to have a control tissue from the same individual for comparison. In this review we describe a new next-generation sequencing approach to identify leukemia-associated mtDNA mutations by using remission samples as control.
by Dr Ilaria Stefania Pagani
Introduction
The identification of acquired somatic mutations in leukemic samples is of considerable importance for diagnosis and prognostication. In order to identify somatic mutations it is necessary to have a control tissue from the same individual for comparison. Non-hematopoietic tissues, such as mesenchymal stromal cells (MSCs) or hair follicles are preferred, but not always available. When patients with leukemia achieve remission, the remission peripheral blood (PB) may be a suitable and easily available control tissue. This article will provide recommendations for the identification of tumour-associated mtDNA somatic mutations, highlighting advantages and disadvantages of the method.
mtDNA characteristics
Human mitochondrial (mt) DNA is a 16 569 bp double-stranded, circular DNA molecule that encodes 13 polypeptides of the oxidative phosphorylation system (OXPHOS), 22 transfer RNAs and 2 ribosomal RNAs. Several important differences between the mt genome and the nuclear genome complicate the study of mtDNA mutations. Ninety-three percent of the sequence consists of coding DNA, introns are absent, the only non-coding region is at the level of the D-loop containing the promoters of the genes and it is maternally inherited. Each cell has a variable number of mitochondria (typically several hundred) and each mitochondrion contains a variable number of genomes (typically 2–10). Consequently, mtDNA mutations do not follow the pattern of a diploid genome: rather, a cell may have a single mt genotype (homoplasmy) or multiple mt genotypes (heteroplasmy). Heteroplasmy may be at any frequency, could vary between cells and many variants will be below the limit of detection of Sanger sequencing, and therefore technically difficult to validate [1]. To date, more than 400 mtDNA mutations have been associated with human diseases, most of them being heteroplasmic. Therefore, an accurate determination of the level of heteroplasmy is important for disease association studies [2].
mtDNA mutations and cancer
MtDNA mutations may potentially contribute to a cell to becoming cancerous, leading to invasion and metastasis [3]. Heteroplasmic somatic mtDNA mutations have been reported in hematological neoplasms, including myelodysplastic syndromes, chronic lymphocytic leukemia, chronic myeloid leukemia (CML), acute myeloid leukemia, and acute lymphoblastic leukemia (ALL) [1]. Many cancer types, including leukemia, have a tendency to be highly glycolytic, increasing the production of the reactive oxygen species (ROS), that lead to genomic instability. The mtDNA genome is susceptible to ROS-induced mutations owing to the high oxidative stress in the mitochondrion and limited DNA-repair mechanisms [3]. The identification of acquired somatic mutations in leukemic samples is of considerable importance for diagnosis and prognostication. In a study in acute myeloid leukemia, for example, patients with mutated NADH dehydrogenase subunit 4 (ND4) showed greater overall survival than patients with wild-type ND4 [4].
mtDNA somatic mutations: the problem of control tissue
MtDNA acquires somatic mutations at a rate 10-fold higher than nuclear DNA, so mtDNA single nucleotide variants (SNVs) accumulate with age, and may be tissue-specific [5]. This means that there is no absolutely reliable source of ‘germline’ mtDNA, especially in older individuals [1]. Somatic mutations must be distinguished from non-pathogenic germline variants by comparison with a control tissue sample. Non-hematopoietic tissues, such as buccal cells, hair follicles or MSCs are preferred, but not always available. PB cells from a post-treatment remission sample may be used as alternative. This method is widely used for nuclear mutations, but less commonly for mt mutations [1]. Blood samples are readily accessible from leukemia patients who achieve morphological remission after treatment. Therefore, a method for the detection of leukemia-associated mtDNA mutations based on comparison with a remission sample may be useful.
A new approach to identify mtDNA somatic mutations at diagnosis by using remission samples as control tissue
Pagani IS and colleagues developed a next-generation sequencing (NGS) approach for the identification of leukemia-associated mtDNA mutations using samples from CML patients at diagnosis and in remission following treatment with tyrosine kinase inhibitors (TKIs) [1]. This approach could also be applied to both hematopoietic and non-hematopoietic cancers, such as epithelial tumours, in which a tumour biopsy specimen can be compared with the normal mucosa.
Twenty-six chronic phase CML patients enrolled in the Australasian Leukaemia and Lymphoma Group CML9 trial (TIDEL-II; ID: ACTRN12607000325404) [6] took part in the study [6]. PB samples from leucocytes at diagnosis before commencing TKI treatment, and remission after 12 months of therapy were compared. Hair follicles (n=4), bone marrow MSCs (n=18), or both (n=4) were used as non-hematopoietic control samples. The comparison of a diagnostic sample with a non-hematopoietic control tissue is the standard method to identify somatic mutations in leukemia [1]. The concordance between this classic method and the diagnosis versus remission approach has been investigated.
NGS assay for the mt genome
The workflow chart is represented in Figure 1. Briefly the genomic DNA (comprising a mixture of nuclear and mtDNA) was extracted by a phenol/chloroform method from PB leukocytes and non-hematopoietic tissues. The mtDNA was amplified by long-range PCR, generating two or three overlapping fragments covering the entire mt genome. The PCR amplicons were then pooled at equimolar concentrations and sequencing libraries were prepared using the Nextera XT kit (Illumina). Indexed libraries were multiplexed and run on an Illumina MiSeq instrument using the 600 cycle MiSeq Reagent kit (v3) generating 300-bp paired-end reads [1].
Somatic mutation calling from high-throughput sequencing datasets and validation
The majority of the variant-calling methods in use are based on low-coverage human re-sequencing data and diploid calls with discrete frequencies of interest (0%, 50% or 100%) [7, 8]; however, these assumptions do not apply to mtDNA. The LoFreq software (loFreq-star version 2.11, genome Institute of Singapore; http://csb5.github.io/lofreq/) was chosen because it was developed for viral and bacterial genomes as well as diploid data, and because of its ability to automate comparison with a matched control tissue for the detection of somatic mutations [8]. The revised Cambridge Reference Sequence (rCRS) for the human mt genome (NC_012920) was used as reference sequence to identify SNVs. Tumour tissue (test) and control were then compared to identify somatic mutations specific only for the tumour tissue. Variants in common between the test and the control sample were considered to represent germline polymorphisms or mutations and were filtered out by the software. A binomial test was applied to the remaining variants to determine whether an apparent difference between samples could be due to inadequate read coverage in the control. Variants passing the binomial test were retained in the final list of putative somatic mutations (Fig. 2a) [8]. The identified mutations should be considered putative and, in common with most other NGS strategies for the discovery of novel mutations, any specific mutation of clinical interest would need to be confirmed using an independent method, as Sanger sequencing (limit of detection 20%), Sequenom MassArray, digital array (Fluidigm) or another NGS platform.
NGS: error rate, false positives and threshold
Before the application of NGS technologies, no evidence of heteroplasmy was detected, probably because of the lower sensitivity of earlier techniques [9]. NGS technologies enable the inquiry of mt heteroplasmy at the genome-wide scale with much higher resolution because many independent reads are generated for each position [2]. However, the higher error rate associated with the more sensitive NGS methodology must be taken into consideration to avoid false detection of heteroplasmy. Short-read sequencing technologies (like in Illumina systems) have a high intrinsic error rate (approximately 1 in 102–103 bases) when applied at the very high depth required to detect and measure low-level heteroplasmy. Thus, appropriate criteria for avoiding false positives due to sequencing errors are required. The most obvious way to distinguish between sequencing errors and heteroplasmy is to invoke a threshold. Two duplicate sequencing run, of which one was ultra-deep (validation run), were compared to determine sensitivity (proportion of true positives that are correctly identified as such) and specificity (proportion of true negatives that are correctly identified as such). An empirical threshold of 2% was therefore applied to distinguish true variants from sequencing errors. Variants with a variant allele fraction (VAF, the variant allele’s read depth divided by total read depth at each nucleotide position) between 2 and 98% where then considered as heteroplasmic, and variants with a VAF >2% were called homoplasmic [1]. This threshold could be refined by an iterative process in which a different threshold is identified for each nucleotide position [10], as some variation in error rate was observed. The incorporation of molecular barcodes in the initial long-range PCR would also reduce the risk of false-positive mutations due to PCR artefact [1].
Remission samples as control tissue in the identification of the mtDNA somatic mutations at diagnosis
In the four patients who had both MSC and hair follicle DNA available as control tissue, the same mutations at diagnosis have been identified, therefore the results using the non-hematopoietic tissues as control were combined. Remission samples were then used as control tissue to determine mtDNA somatic mutations at diagnosis, and the concordance between this method and the conventional diagnosis versus the MSC/hair follicle approach was examined. Seventy-three somatic mutations (81%) were identified in common, 11 mutations (12%) were identified only in comparison with the non-hematopoietic control, and six (6.7%) only by comparison with remission samples (Fig. 2b) [1]. Divergent results occurred as the result of differences in read quality or depth at a specific nucleotide not reaching statistical significance in the algorithm. False-negative results could be encountered using remission samples as the control tissue, because of low-level heteroplasmic mutations in the control sample that would lead to the same mutation at diagnosis being removed through filtering.
Concluding remarks
Remission samples can be used as control tissues to detect candidate mtDNA somatic mutations in leukemic samples when non-hematopoietic tissues are not available. The presence of mutations at low VAF in the remission samples in common with the diagnosis tissue, could be filtered out by the LoFreq software leading to false-negative results. Therefore visual inspection of the unfiltered variants is recommended.
References
1. Pagani IS, Kok CH, Saunders VA, van der Hoek MB, Heatley SL, Schwarer AP, Hahn CN, Hughes TP, White DL, Ross DM. A method for next-generation sequencing of paired diagnostic and remission samples to detect mitochondrial DNA mutations associated with leukemia. J Mol Diagn 2017; 19(5): 711–721.
2. Li M, Schonberg A, Schaefer M, Schroeder R, Nasidze I, Stoneking M. Detecting heteroplasmy from high-throughput sequencing of complete human mitochondrial DNA genomes. Am J Hum Genet 2010; 87(2): 237–249.
3. van Gisbergen MW, Voets AM, Starmans MH, de Coo IF, Yadak R, Hoffmann RF, Boutros PC, Smeets HJ, Dubois L, Lambin P. How do changes in the mtDNA and mitochondrial dysfunction influence cancer and cancer therapy? Challenges, opportunities and models. Mutat Res Rev Mutat Res 2015; 764: 16–30.
4. Damm F, Bunke T, Thol F, Markus B, Wagner K, Gohring G, Schlegelberger B, Heil G, Reuter CW, et al. Prognostic implications and molecular associations of NADH dehydrogenase subunit 4 (ND4) mutations in acute myeloid leukemia. Leukemia 2012; 26(2): 289–295.
5. Gattermann N. Mitochondrial DNA mutations in the hematopoietic system. Leukemia 2004; 18(1): 18–22.
6. Yeung DT, Osborn MP, White DL, Branford S, Braley J, Herschtal A, Kornhauser M, Issa S, Hiwase DK, et al. TIDEL-II: first-line use of imatinib in CML with early switch to nilotinib for failure to achieve time-dependent molecular targets. Blood 2015; 125(6): 915–923.
7. Meldrum C, Doyle MA, Tothill RW. Next-generation sequencing for cancer diagnostics: a practical perspective. Clin Biochem Rev 2011; 32(4): 177–195.
8. Wilm A, Aw PP, Bertrand D, Yeo GH, Ong SH, Wong CH, Chiea CK, Rosemary P, Martin LH, Niranjan N. LoFreq: a sequence-quality aware, ultra-sensitive variant caller for uncovering cell-population heterogeneity from high-throughput sequencing datasets. Nucleic Acids Res 2012; 40(22): 11189–11201.
9. Chatterjee A, Dasgupta S, Sidransky D. Mitochondrial subversion in cancer. Cancer Prev Res 2011; 4(5): 638–654.
10. Kerpedjiev P, Frellsen J, Lindgreen S, Krogh A. Adaptable probabilistic mapping of short reads using position specific scoring matrices. BMC Bioinformatics 2014; 15: 100.
The author
Ilaria Stefania Pagani1,2 PhD
1Cancer Theme, South Australian Health & Medical Research Institute, Adelaide, Australia
2School of Medicine, Faculty of Health Sciences, University of Adelaide, Adelaide, Australia
*Corresponding author
E-mail: Ilaria.pagani@sahmri.com
A 28-year-old African community youth worker, Evah Namakula, has won the first, global CARES HIV/AIDS award, designed to recognize ordinary people who have shown ‘care, dedication and commitment’ in their communities as part of the fight against the disease. Ms Namakula was also part of the 2018 award launch at the International Aids Society meeting in Amsterdam (July 23 – 27).
In its first year, the CARES award focused on the dedication of ordinary people in Africa, one of the areas in the world most affected by HIV/AIDS. The award has two categories of winners – an individual, Ms Namakula, and an organization, the Hillcrest AIDS Centre Trust (HACT). This is a South African charity that cares for some of the poorest and most disadvantaged people in Africa.
Each year the winning organization will receive a grant of 5500 USD provided by Beckman Coulter Life Sciences through the Beckman Coulter Foundation. The grant is made in the name of the individual winner, but their work cannot be linked.
An independent judging panel described as ‘remarkable’ Ms Namakula’s achievements in her local Ugandan community to dispel the stigma of HIV/AIDs. She is also global youth ambassador for Reach Out Integrity (ROI) Africa, where she helps to promote health and sexual responsibility to young people. Evah has recently founded her own charity, IGNITE, to carry her work forward.
Ms Namakula is part of the Young African Leaders Initiative (YALI) set up by President Barak Obama to empower leadership skills in African youth. As a YALI volunteer, she has been working as a leadership mentor in local communities and schools, helping to develop public speaking skills.
Inspired as a child by the determination of her mother and siblings, Evah said: “l had already become a campaigner, but it was while l was working in my local hospital laboratory that I realized how I could use my medical knowledge to reduce the myth young people in my community had about HIV/AIDs.”
“Evah is an inspirational young woman and will be a hard act to follow,” said Samuel Boova, Beckman Coulter’s Director Alliance Development, High Burden HIV Markets. “She is exactly the kind of youth leader that President Obama wanted to encourage to develop the Africa of the future and we are honoured not only to have her as our first winner, but to have her support in launching the global initiative.
“The award gives a platform to the work and stories of those we see as the unsung heroes of individual communities. These are people who have shown individual dedication, commitment and courage or who have made a difference in the battle against HIV/AIDS.
“However, it is not just the final winner we want to publically recognize. We hope the award will encourage communities to learn about and honour the work of every nominee, so that more people will come forward to help and support those living with HIV/AIDS.”
Potential candidates for the CARES award can be nurses, healthcare workers, national coordinators, lab scientists and even clinicians. It could include lay people who are active in community outreach work or a social worker providing AIDS counselling.
CARES supports the UNAIDS 90-90-90 target to ensure that by the year 2020, 90% of people living with HIV will know their status, 90% of those with diagnosed HIV infection will receive sustained antiretroviral therapy, and 90% of all people receiving antiretroviral therapy will have viral suppression.
It focuses on encouraging innovative solutions for the monitoring of HIV and AIDS treatment. It was inspired by the work of Professor Debbie Glencross, a leading South African laboratory pathologist, who found an inexpensive way to measure a patient’s CD4 count, a special type of white blood cell that can indicate how compromised a person’s immune system might be. Prof Glencross is Director and Principle Pathologist in the Flow Cytometry unit of the Department of Hematology at the Charlotte Maxeke Johannesburg Academic Hospital.
Monitoring a patient’s immune system by counting the CD4 cells has to be carried out by laser technology in a special blood analyser, the flow cytometer. However, in many parts of rural Africa, the equipment and infrastructure simply hasn’t been available to test patients, get their blood samples to a laboratory, and then report the results. As Prof Glencross explained: “We are working to empower smaller community laboratories so that they can extend the availability of the test to meet demand while still meeting the requirements of the National Health Laboratory Service. This will enable best clinical and laboratory practice while reducing the time it takes to deliver the result.”
When counting CD4 cells, large global hospital labs first differentiate between the types of white blood cells, count them and then work out the number of CD4 cells in each millionth of a liter of blood. While accurate, this method can be laborious. In contrast, rather than going through the time-consuming and costly process of isolating individual antibodies, Glencross’s ingenious approach uses a mathematical equation. She realized that using the white cell count as a stable reference point would eliminate the need for additional quality control steps, while still maintaining standards.
Parkinson’s disease (PD) is a chronic neurological disorder affecting one in 100 people over the age of 60, with estimates suggesting that approximately 5 million people are suffering from the condition worldwide. PD develops when the dopamine-producing neurons of the substantia nigra part of the brain are lost over time. Dopamine is needed for the coordination of movement, the loss of which is therefore responsible for the appearance of the main PD symptoms of stiffness, tremor and slowness. There is no cure for PD and treatment is aimed at managing symptoms, with medication being effective only in the short term. Currently there is no clinical test for PD, but diagnosis is based on medical history and assessment of simple physical tasks. Additionally, most instances of PD are idiopathic, with the risks from genetic and/or environmental causes being very low, except in certain rare cases. Hence, diagnosis, particularly in the early stages of symptoms, can be difficult and inconclusive. Additionally, as with many of the neurodegenerative conditions, physical symptoms only become apparent late in the development of the condition – after the loss of 80% of dopamine. However, the help of a woman with a remarkable sense of smell is bringing the creation of a definitive clinical test for PD closer. Joy Milne is a retired nurse from Perth, Scotland, whose husband Les, a consultant anesthetist, was diagnosed with PD at the age of 45 and died at 65. Approximately 10 years before the diagnosis, Joy realized that Les had developed a different, slightly muskier smell. After meeting other people with PD, Joy found that they all had the same unusual aroma. Joy’s ability to detect PD by smell was confirmed in tests conducted by scientists at the University of Edinburgh and she is now working with Dr Perdita Barran at the University of Manchester to isolate the specific compounds that create the distinctive PD aroma. So far, a handful of compounds have been identified. Currently, a definitive clinical test would allow a conclusive diagnosis for patients suffering from the varied and vague early symptoms of PD. In the future, however, given the lack of identifiable risk factors and the fact that the changes responsible for PD as well as the development of the unusual PD aroma happen up to a decade before external physical symptoms appear, for any medication that will cure or at least prevent disease progression to have any real chance of success, screening of the apparently healthy, asymptomatic population will have to be carried out.
Monoclonal gammopathy (MG) refers to the presence of monoclonal immunoglobulin produced by clonally expanded plasma cells or immunoglobulin-expressing lymphocytes. MG is a key feature of a wide spectrum of diseases ranging from the indolent MG of undetermined significance to the overt multiple myeloma. In this article, we discuss the utility and pitfalls of common biochemical techniques used to detect MG.
by Dr Michelle L. Parker and Dr Pak Cheung Chan
Introduction
The monoclonal immunoglobulins or ‘M-proteins’ detected in monoclonal gammopathy (MG) are produced by clonally expanded plasma cells, or less frequently by immunoglobulin-expressing lymphocytes at different stages of maturation. The prevalence of MG in the general population over 50 years of age is approximately 3 % and increases with age. M-proteins secreted by plasma cells (Fig. 1a) can be partial or intact immunoglobulins, with the latter consisting of two heavy chains and two light chains that together form a Y-shaped structure with constant and highly variable antigen-binding domains (Fig. 1b). M-proteins that are immunologically functional may cause disease by directly binding to self-antigens, e.g. in some peripheral neuropathy. Other unique chemical properties may cause the M-protein to transform into insoluble amyloids, to increase plasma viscosity, or even to block capillary blood flow by precipitating out at the low temperatures in the extremities. As the production of M-protein increases, the mass effect can be exerted through the expanded clonal plasma cells compressing neighbouring cell lineages in the bone marrow, resulting in reduced red blood cell production (anemia), pan-leukopenia (recurrent infections), thrombocytopenia (bleeding diathesis), suppressed non-involved plasma cells (immune paresis) and bone resorption (hypercalcemia and bone lesions). Large amounts of circulating M-protein could promote plasma hyperviscosity, thrombosis, and tissue and organ damage. For example, excess filtered free light chains in multiple myeloma can directly damage the kidney proximal tubules, form amyloids rupturing glomeruli and form obstructive casts in the distal tubules leading to cell death and nephritis. In general, measured M-protein concentration is taken to reflect the tumour burden and is prognostic for disease progression or survival, e.g. in monoclonal gammopathy of undetermined significance (MGUS), smouldering myeloma and multiple myeloma.
Conditions associated with MG cover a wide range of clinical presentations and severity, including MGUS, multiple myeloma, P.O.E.M.S., light chain deposition disease, plasmacytoma, Waldenstrom’s macroglobulinemia, non-Hodgkin’s lymphoma and chronic lymphocytic leukemia. In some of these diseases, the severity of tissue or organ damage may not be related to the M-protein concentration. For example, in some amyloid light chain (AL)-amyloidosis, extensive kidney damage is reflected by massive proteinuria, yet the circulating monoclonal free light chain can be barely, or not at all, demonstrable by serum and/or urine testing [1]. Nevertheless, the presence of an M-protein can be a defining hallmark of many of these conditions and its detection provides a critical link to their final diagnosis.
Biochemical detection of monoclonal immunoglobulins
Five common biochemistry tests form the core of first-line MG investigations and will be discussed below: serum protein electrophoresis (SPE), serum immunofixation electrophoresis (IFE), urine protein electrophoresis (UPE), urine immunofixation electrophoresis (uIFE), and serum free light chain (sFLC) assays. Other techniques such as mass spectrometry-based assays and HevyliteTM analysis are increasingly available for specific circumstances but will not be discussed here.
SPE and UPE
SPE and UPE resolve serum and urine proteins respectively into five or six major fractions, viz. albumin, alpha-1, alpha-2, beta (total beta, or beta-1 and beta-2 depending on resolution), and gamma (Fig. 2). If a monoclonal antibody is present, an additional peak may be observed, most frequently in the gamma (hence the term gammopathy) (Fig. 2) but other regions such as beta and alpha-2 are also possible. Estimating the size of this extra peak gives the amount of M-protein present and is one of the recommended methods for monitoring disease activity. However, the detection of M-protein this way requires that it is readily distinguished from background polyclonal immunoglobulins or other co-migrating proteins, which not only limits the analytical sensitivity to around 0.5–2.0 g/L [2] and prevents its use to rule-out low abundance M-proteins [3, 11], but also limits the accuracy of quantification especially at low M-protein concentrations and/or high background in any electrophoretic regions.
Importantly, an ‘abnormal’ peak identified by SPE does not prove that it is an endogenous monoclonal immunoglobulin, as the peak may be due to a haptoglobin variant, iodinated contrast material, aminoglycoside, administered biologics, or increases in other proteins such as tumour markers, transferrin in severe iron deficiency, C-reactive protein in acute inflammation, and fibrinogen in plasma or incompletely clotted serum [4]. Similarly, a positive finding in UPE can only be regarded as presumptive and should be confirmed by techniques such as IFE.
Historically, qualitative deviations from the expected SPE pattern have been taken to imply clinical conditions such as bisalbuminemia, acute-phase inflammatory response, alpha-1-antitrypsin deficiency, nephrotic syndrome, cirrhosis, hypogammaglobulinemia, etc. However, not all of these conditions as predicted by SPE patterns have been validated, nor have their clinical utility in terms of MG investigation been established [5].
IFE and uIFE
For IFE, a combination of antisera against the heavy chains (IgG, IgA, IgM, IgD, IgE), the two light chains (total kappa and total lambda) and/or the free light chains (free kappa and free lambda) is selected and separately overlaid on the electrophoresed sample. Immuno-precipitation results in a blush of staining in the presence of polyclonal immunoglobulins, while a discrete band indicates the presence of an M-protein and its isotype is determined when discrete bands in the heavy and light chain lanes are aligned (Fig. 2 inset). This immunological detection not only characterizes the M-protein whose isotype provides prognostic information, but also improves the analytical sensitivity (typically 0.2 to 0.5 g/L) enabling detection of M-proteins even when the SPE pattern is visibly normal [2]. However, a notable short fall is that the interpretation is unavoidably subjective especially when bands are faint or not well defined.
In uIFE, the focus is to detect monoclonal free light chains or Bence Jones proteins that passed through the kidneys unabsorbed. In normal individuals, immunoglobulin light chains are produced in slight excess of the heavy chains and are secreted into the circulation. Because of their small sizes, free light chains are readily filtered through the glomeruli but are efficiently absorbed in the proximal tubules. Thus, in patients with MG, the detection of monoclonal free light chains in urine usually indicates an increased production exceeding renal reabsorbing capacity, compromised reabsorption, or both. Since the secretion of free light chains into the circulation is sporadic throughout the day, a ‘pooled’ sample such as a 24-h urine collection usually improves the sensitivity as well as the reliability of urine testing, although a first-morning urine has also been accepted for initial investigations.
sFLC assays
The fully automated sFLC measures polyclonal immunoglobulin free light chains individually with high analytical sensitivity (down to mg/L) and targets the light chain epitopes that are otherwise hidden when bound to heavy chains (Fig. 3)[2]. Patients with MG often have increased concentrations of the involved free light chains, resulting in a skewed free kappa/lambda ratio as the uninvolved free light chains remains normal or suppressed. A skewed ratio not only supports the diagnosis of MG but also provides prognostication information on malignant progression for MGUS, smouldering myeloma and multiple myeloma. A free kappa/lambda ratio >100 has even been taken as a defining feature for multiple myeloma [6].
Similar to many other immunoassays, the sFLC assay is subject to antigen excess and displays dilutional non-linearity, raising concern over the accuracy of results at both high concentrations (variation due to different dilution response) and low concentrations (high dose hook effect). Additionally, falsely abnormal free kappa/lambda ratios have been reported in individuals with polyclonal gammopathy, hospitalized patients and patients with renal dysfunction. In one study, the reported positive predictive value of an abnormal ratio amongst primary care patients was only 39 % [7], underscoring the high false-positive rate in unselected patients. Although there are sFLC assays reportedly less susceptible to these limitations [8], a general lack of standardization renders the results non-commutable and values cannot be interchanged between methods.
Diagnostic testing algorithms
Although the biochemical tests discussed above play an important role in the detection of M-proteins, the information that each test provides does overlap substantially, and different test combinations may be required for different monoclonal gammopathies. Moreover, these tests tend to be costly, labour intensive, and/or require expertise for result interpretation. There is ongoing debate on the optimal testing algorithm due to competing priorities such as maximizing clinical sensitivity or diagnostic efficiency, streamlining workflows, improving economic feasibility, and reducing unnecessary or redundant testing.
With a primary goal of maximizing clinical sensitivity, the International Myeloma Working Group (IMWG) recommends SPE, IFE and sFLC as first-line tests for confirming multiple myeloma and other plasma cell disorders, with the addition of 24-hour urine studies only if AL-amyloidosis is suspected [2, 8]. Although the recommendation falls short of indicating that these tests may be performed in tandem depending on findings, it does represent a welcomed change to previous versions as 24-h urine samples are inconvenient to collect and UPE and uIFE are expensive to perform. Although sFLC testing has largely obviated the need for first-line urine studies, no single serum test has adequate clinical sensitivity for screening all plasma cell disorders [8, 9]; in one large study, SPE, IFE and sFLC had clinical sensitivities of just 79, 87 and 74 % respectively [3].
The optimal combination of first-line and reflexed tests remains difficult to determine owing to the wide spectrum of MG diseases. There is substantial redundancy if SPE and IFE are performed simultaneously. IFE contains a protein lane that provides the same qualitative detection of M-proteins as SPE. A separate SPE only provides additional information regarding quantity of the M-protein, as there are no true positives that would be missed by IFE but identified by SPE. For economic and other reasons, SPE is often performed initially and is reflexed to IFE for confirmation if SPE presents with features suggestive of an M-protein, including the observation of restricted staining or a clearly discrete band, increased beta fraction [10], or decreased gamma fraction [11]. However, this approach has been shown to miss up to 20 % of cases [3, 10–12] as some M-proteins, especially free light chains and those existing in small concentrations, may not present with any abnormal features in SPE. Recently, it was argued that the increased sensitivity of IFE over SPE warrants its use as the first-line screening test, despite being more expensive and labour intensive. The use of modified IFE protocols such as combined light chain immunofixation (a mixture of anti kappa and anti-lambda antisera), or the penta-IFE using a mixture of five antisera (anti IgG, IgA, IgM, kappa, and lambda) seems to make this approach more feasible. The counterpoint to this approach, though, is that the detection of very low concentration M proteins by IFE may lead to unnecessary investigation of transient or low risk conditions [13]. On the other hand, without full characterization of the M-protein (both isotype and concentration), it may be premature to judge the significance of an M-protein based only on its low concentration.
Concluding Remarks
Clearly, further studies are needed to balance the competing priorities of various testing algorithms and provide evidence-based approaches to MG investigations suited to the diverse clinical environments, ranging from family practice to speciality hematology clinics. Irrespective of the algorithm used, it is good practice to interpret laboratory findings within the specific clinical context to mitigate the risk of false-positive or false-negative test results.
References
1. Truong D, Blasutig IM, Kulasingam V, Chan PC. A patient with monoclonal gammopathy-related nephrotic syndrome revealed no electrophoretic “nephrotic pattern” or skewed free light chain ratio. Clin Biochem 2018; 51: 110–111.
2. Dispenzieri A, Kyle R, Merlini G, Miguel JS, Ludwig H, Hajek R, et al. International Myeloma Working Group guidelines for serum-free light chain analysis in multiple myeloma and related disorders. Leukemia 2009; 23(2): 215–224.
3. Katzmann JA, Kyle RA, Benson J, Larson DR, Snyder MR, Lust JA, et al. Screening panels for detection of monoclonal gammopathies. Clin Chem 2009; 55(8): 1517–1522.
4. McCudden CR, Jacobs JFM, Keren D, Caillon H, Dejoie T, Andersen K. Recognition and management of common, rare, and novel serum protein electrophoresis and immunofixation interferences. Clin Biochem 2018; 51: 72–79.
5. Chan PC, Chen Y, Randell EW. On the path to evidence-based reporting of serum protein electrophoresis patterns in the absence of a discernible monoclonal protein – A critical review of literature and practice suggestions. Clin Biochem 2018; 51: 29–37.
6. Rajkumar SV, Dimopoulos MA, Palumbo A, Blade J, Merlini G, Mateos MV, et al. International Myeloma Working Group updated criteria for the diagnosis of multiple myeloma. Lancet Oncol 2014; 15(12): e538–548.
7. Hill PG, Forsyth JM, Rai B, Mayne S. Serum free light chains: An alternative to the urine Bence Jones proteins screening test for monoclonal gammopathies. Clin Chem 2006; 52(9): 1743–1748.
8. Tate JR, Graziani MS, Mollee P, Merlini G. Protein electrophoresis and serum free light chains in the diagnosis and monitoring of plasma cell disorders: laboratory testing and current controversies. Clin Chem Lab Med 2016; 54(6): 899–905.
9. Willrich MAV, Murray DL, Kyle RA. Laboratory testing for monoclonal gammopathies: focus on monoclonal gammopathy of undetermined significance and smoldering multiple myeloma. Clin Biochem 2018; 51: 38–47.
10. Chan PC, Lem-Ragosnig B, Chen J. Diagnostic implications of enumerating and reporting beta fraction(s) for the detection of beta-migrating monoclonal immunoglobulins in serum protein electrophoresis. Clin Biochem 2018; 53: 77–80.
11. Chan PC, Chen J. Value of reflex testing based on hypogammaglobulinemia as demonstrated in serum protein electrophoresis. Clin Biochem 2015; 48: 674–678.
12. Pretorius CJ. Screening immunofixation should replace protein electrophoresis as the initial investigation of monoclonal gammopathy: Point. Clin Chem Lab Med 2016; 54(6): 963–966.
13. Smith JD, Raines G, Schneider HG. Should routine laboratories stop doing screening serum protein electrophoresis and replace it with screening immune-fixation electrophoresis? No quick fixes: Counterpoint. Clin Chem Lab Med 2016; 54(6): 967–971.
The authors
Michelle L. Parker1 PhD, Pak Cheung Chan*1,2 PhD, DABCC, FCACB
1Department of Laboratory Medicine and Pathobiology, University of Toronto, Toronto, ON, Canada
2Department of Laboratory Medicine & Molecular Diagnostics, Sunnybrook Health Sciences Centre, Toronto, ON, Canada
*Corresponding author
E-mail: pc.chan@sunnybrook.ca
February | March 2025
The leading international magazine for Clinical laboratory Equipment for everyone in the Vitro diagnostics
Beukenlaan 137
5616 VD Eindhoven
The Netherlands
+31 85064 55 82
info@clinlabint.com
PanGlobal Media is not responsible for any error or omission that might occur in the electronic display of product or company data.
This site uses cookies. By continuing to browse the site, you are agreeing to our use of cookies.
Accept settingsHide notification onlyCookie settingsWe may ask you to place cookies on your device. We use cookies to let us know when you visit our websites, how you interact with us, to enrich your user experience and to customise your relationship with our website.
Click on the different sections for more information. You can also change some of your preferences. Please note that blocking some types of cookies may affect your experience on our websites and the services we can provide.
These cookies are strictly necessary to provide you with services available through our website and to use some of its features.
Because these cookies are strictly necessary to provide the website, refusing them will affect the functioning of our site. You can always block or delete cookies by changing your browser settings and block all cookies on this website forcibly. But this will always ask you to accept/refuse cookies when you visit our site again.
We fully respect if you want to refuse cookies, but to avoid asking you each time again to kindly allow us to store a cookie for that purpose. You are always free to unsubscribe or other cookies to get a better experience. If you refuse cookies, we will delete all cookies set in our domain.
We provide you with a list of cookies stored on your computer in our domain, so that you can check what we have stored. For security reasons, we cannot display or modify cookies from other domains. You can check these in your browser's security settings.
.These cookies collect information that is used in aggregate form to help us understand how our website is used or how effective our marketing campaigns are, or to help us customise our website and application for you to improve your experience.
If you do not want us to track your visit to our site, you can disable this in your browser here:
.
We also use various external services such as Google Webfonts, Google Maps and external video providers. Since these providers may collect personal data such as your IP address, you can block them here. Please note that this may significantly reduce the functionality and appearance of our site. Changes will only be effective once you reload the page
Google Webfont Settings:
Google Maps Settings:
Google reCaptcha settings:
Vimeo and Youtube videos embedding:
.U kunt meer lezen over onze cookies en privacy-instellingen op onze Privacybeleid-pagina.
Privacy policy