Beukenlaan 137
5616 VD Eindhoven
The Netherlands
+31 85064 55 82
info@clinlabint.com
PanGlobal Media is not responsible for any error or omission that might occur in the electronic display of product or company data.
This article examines the case of a patient who developed toxic levels of voriconazole while taking the antifungal prophylactically as part of her treatment regimen in addition to standard chemotherapy for a leukocyte neoplasm. The usefulness of molecular diagnostic testing as an aid in voriconazole dosing is discussed.
by S. Rezaei, L. Collier and Dr S. Taylor
Case report
The patient was a 14-year-old female who was referred to the emergency department with a 10-day history of generalized bone pain and progressively worsening fatigue. An initial complete blood count (CBC) revealed a white blood cell (WBC) count that was well within the normal range, and only slight anemia and thrombocytopenia. However, because marked neutropenia and elevated numbers of leukemic blasts were noted in the differential, a bone marrow (BM) examination was performed. Marrow aspiration was markedly hypercellular with diffuse clusters of blasts (Fig. 1). Flow cytometry on the aspirate disclosed a significant (50% of total sample) blast population that exhibited CD33, CD13 (partial, dim), CD34 (partial), CD15 (heterogeneous), CD19 (dim), CD10 (dim), HLA-DR, CD64 (partial, dim), CD71 (dim), CD117, CD123, CD58, CD38, cytoplasmic CD79a, CD45 (dim), Tdt, and myeloperoxidase markers. These same markers were exhibited by the circulating blasts in her peripheral blood. The co-expression of B-lymphoid and myeloid antigens prompted an initial diagnosis of biphenotypic acute leukemia. After multiple expert consultations, it was decided to model the patient’s treatment on therapy for acute lymphocytic leukemia (ALL). Thus, the patient received prednisone, vincristine, daunorubicin and PEG asparaginase as induction chemotherapy, with vincristine and daunorubicin administered again 7 days later.
Cytogenetic test results that were returned on day 8, revealed a chromosomal translocation of (8;21)(q22;q22); RUNX1-RUNX1T1, which changed the patient’s diagnosis to an atypical form of acute myelogenous leukemia (AML). Accordingly, the patient’s chemotherapy regimen was changed so that the ALL-type therapy was discontinued and standard AML therapy that included cytarabine, daunorubicin, and etoposide was begun. To address other specific issues, this patient was treated with multiple medications along with her chemotherapy drugs, including Ambien, Bactrim, Benadryl, cefepime, cyproheptadine, hydroxyzine, meropenem, vancomycin, and voriconazole.
On day 16, 8 days after the start of her new pharmacology regimen, the patient began to experience fluctuating confusion and auditory/visual hallucinations. Screening tests revealed no abnormalities that could explain her altered mental status, so attention turned to the medications that she was receiving. All medications that seemed likely to contribute to her neurologic problems were suspended and then reintroduced gradually with no adverse effect. Voriconazole was not suspected of being contributory to her altered mental status, and was not interrupted. This antifungal was first administered to the patient on day 8 of her ordeal, at 200 mg/twice daily. She continued to receive this dose from day 8 onwards, until 4 days after her initial neurological trouble (day 20). At this time, her plasma voriconazole level was determined to be >10.0 μg/mL [normal range (NR): 1.0–6.0 μg/mL]. The patient’s 200 mg twice a day dosing regimen was reduced to 100 mg twice a day. Her plasma concentration of voriconazole was monitored regularly until its level plateaued at 2 μg/mL (Fig. 2).
Pharmacogenomics
Voriconazole is an efficient triazole agent used as an antifungal prophylactic in this patient as she was receiving immunosuppressive chemotherapy. Patients with hematologic malignancies are at high risk of aspergillosis and candidiasis infections, because of the neutropenia that is often caused by their chemotherapy regimens [1–3].
Voriconazole is extensively metabolized in the liver, primarily by CYP2C19 and, to a lesser extent, by CYP2C9 and CYP3A4 liver enzymes. The CYP2C19 genotype is generally accepted as the key determinant in voriconazole clearance [4–6]. Variants of the CYP2C19 genotype have been identified and assigned enzyme activity. Thus the CYP2C19*1 variant is the wild-type variant and exhibits normal enzyme activity. CYP2C19 *2, *3, *4, *5, *6, and *8 isotypes display loss of functionality as they possess little or no activity, and the CYP2C19*17 variant is assigned gain-of-function status because of its robust enzyme activity (Table 1) [7, 8].
Individuals who possess a normal or wild-type drug metabolizing phenotype inherit two copies of the normal CYP2C19 genotype (*1/*1), and are designated as extensive metabolizers (EM). Intermediate metabolizers (IM) have any one of the *2–*8 alleles coupled with a normally functioning (*1) allele. Poor metabolizers (PM) are individuals with an enzyme activity phenotype that is less than optimal, caused by a genotype consisting of loss-of-function alleles (*2–*8/*2–*8 ). Ultrarapid metabolizers (UM) are at the other end of the enzyme activity spectrum, they may either be heterozygous ultrarapid metabolizers with a wild-type allele combined with an gain-of-function allele (*1/*17 genotype), or they may be homozygous ultrarapid metabolizers with only gain-of-function alleles (*17/*17) (Table 1) [7, 8]. The drug metabolizing phenotype of individuals with the gain-of-function allele (*17) combined with a loss-of-function allele (*2–*8) is less clear. There is a certain amount of dissention in the literature as to how these individuals should be classified, that is, various researchers classify them as ultrarapid, extensive, intermediate, or unknown metabolizers [7, 9].
It is intuitive that an individual’s CYP2C19 genotype fundamentally contributes to voriconazole metabolism, elimination, and therefore bioavailability of the drug [4–6].
Systemic exposure to voriconazole is generally higher in individuals with reduced ability to metabolize and eliminate the drug. Trough plasma concentrations of voriconazole have been significantly higher in people possessing PM phenotypes followed by individuals with an IM phenotype, with the lowest bioavailability of the drug detected in individuals with an EM or UM phenotype [4–6, 8]. However, higher trough levels of voriconazole are not universally higher in individuals with reduced CYP2C19 activity [8, 10]. Voriconazole displays expected pharmacokinetic behaviour according to genotype in healthy volunteers, but there is often a marked departure from the customary dose/response relationship in patients. Presumably this deviation from expected pharmacokinetic behaviour is due to drug–drug interactions and/or the pathological circumstances of the patient [5, 6]. Generally, it is expected that disease circumstances or drug side effects that reduce liver enzyme activity (especially of CYP2C19, CYP2C9 and CYP3A4) will decrease metabolism and clearance of voriconazole, and thus increase patient exposure to the drug.
Therapeutic drug monitoring
The United States Food and Drug Administration and the Infectious Diseases Society of America recommend therapeutic drug monitoring (TDM) for patients receiving voriconazole [7]. Numerous studies indicate that voriconazole trough values should be maintained above 1.0 μg/mL for fungal prophylaxis. Moreover, some studies indicate that voriconazole is more efficacious when trough levels are maintained at 2.0 μg/mL or higher [11, 12].
It is important to dose voriconazole accurately, as voriconazole efficacy is dependent on adequate exposure to the drug; however, increased trough levels are associated with numerous severe adverse effects (SAE). Voriconazole has been linked to several adverse events including abnormal liver function tests, gastrointestinal disturbances, rash and vomiting. Neurotoxicity (visual disturbances, hallucinations) is somewhat infrequently observed [1, 2]. Since CYP2C19 is a key metabolizer of voriconazole, it seems reasonable to predict a patient’s drug metabolizing phenotype based on their CYP2C19 genotype, and to use this information to guide dosing. In practice, the drug metabolizing genotype alone is not sufficient to predict the metabolizing phenotype. Confounding variables include the fact that voriconazole has a high propensity for drug–drug interactions, a narrow therapeutic index, it exhibits non-linear pharmacokinetics, and its clearance is affected by circumstances such as patient sex, age, disease state, liver function, obesity and the presence of inflammation [11, 13, 14].
Conclusion
The pharmacodynamic behaviour of voriconazole remains difficult to predict as it displays considerable interpatient and intrapatient variablility. Although TDM for patients receiving voriconazole is recommended, establishing a patient’s pharmacogenomic profile can provide clinicians with valuable information to aid in appropriate voriconazole dosing, especially in the initial stages of therapy. Pharmacogenomic information is likely to contribute to the goal of rapidly attaining a therapeutic concentration while avoiding toxicity. It is possible that our patient has a PM phenotype for voriconazole and that pharmacogenomic testing might have minimized her exposure to toxic levels of voriconazole that arose from standard voriconazole dosing.
References
1. Barreto JN, Beach CL, Wolf RC, Merten JA, Tosh PK, Wilson JW, Hogan WJ, Litzow MR. The incidence of invasive fungal infections in neutropenic patients with acute leukemia and myelodysplastic syndromes receiving primary antifungal prophylaxis with voriconazole. Am J Hematol. 2013; 88(4): 283–288.
2. Mattiuzzi GN, Cortes J, Alvarado G, Verstovsek S, Koller C, Pierce S, Blamble D, Faderl S, Xiao L, Hernandez M, Kantarjian H. Efficacy and safety of intravenous voriconazole and intravenous itraconazole for antifungal prophylaxis in patients with acute myelogenous leukemia or high-risk myelodysplastic syndrome. Support Care Cancer. 2011; 19(1): 19–26.
3. Rüping MJ, Müller C, Vehreschild JJ, Böhme A, Mousset S, Harnischmacher U, Frommolt P, Wassmer G, Drzisga I, Hallek M, Cornely OA. Voriconazole serum concentrations in prophylactically treated acute myelogenous leukaemia patients. Mycoses. 2011; 54(3): 230–233.
4. Ashbee HR, Gilleece MH. Has the era of individualised medicine arrived for antifungals? A review of antifungal pharmacogenomics. Bone Marrow Transplant. 2012;47(7): 881–894.
5. Dolton MJ, McLachlan AJ. Voriconazole pharmacokinetics and exposure-response relationships: assessing the links between exposure, efficacy and toxicity. Int J Antimicrob Agents. 2014;44(3): 183–193.
6. Dolton MJ, Mikus G, Weiss J, Ray JE, McLachlan AJ. Understanding variability with voriconazole using a population pharmacokinetic approach: implications for optimal dosing. J Antimicrob Chemother. 2014;69(6): 1633–1641.
7. Owusu OA1, Egelund EF, Alsultan A, Peloquin CA, Johnson JA. CYP2C19 polymorphisms and therapeutic drug monitoring of voriconazole: are we ready for clinical implementation of pharmacogenomics? Pharmacotherapy. 2014;34(7): 703–718.
8. Moriyama B, Kadri S, Henning SA, Danner RL, Walsh TJ, Penzak SR. Therapeutic drug monitoring and genotypic screening in the clinical use of voriconazole. Curr Fungal Infect Rep. 2015;9(2): 74–87.
9. Swen JJ, Nijenhuis M, de Boer A, Grandia L, Maitland-van der Zee AH, Mulder H, Rongen GA, van Schaik RH, Schalekamp T, Touw DJ, van der Weide J, Wilffert B, Deneer VH, Guchelaar HJ. Pharmacogenetics: from bench to byte-an update of guidelines. Clin Pharmacol Ther. 2011; 89(5): 662–673.
10. Kim SH, Yim DS, Choi SM, Kwon JC, Han S, Lee DG, Park C, Kwon EY, Park SH, Choi JH, Yoo JH. Voriconazole-related severe adverse events: clinical application of therapeutic drug monitoring in Korean patients. Int J Infect Dis. 2011;15(11): 753–758.
11. Davies-Vorbrodt S, Ito JI, Tegtmeier BR, Dadwal SS, Kriengkauykiat J. Voriconazole serum concentrations in obese and overweight immunocompromised patients: a retrospective review. Pharmacotherapy. 2013 Jan;33(1): 22–30.
12. Smith J, Safdar N, Knasinski V, Simmons W, Bhavnani SM, Ambrose PG, Andes D. Voriconazole therapeutic drug monitoring. Antimicrob Agents Chemother. 2006;50(4): 1570–1572.
13. van Wanrooy MJ, Span LF, Rodgers MG, van den Heuvel ER, Uges DR, van der Werf TS, Kosterink JG, Alffenaar JW. Inflammation is associated with voriconazole trough concentrations. Antimicrob Agents Chemother. 2014;58(12): 7098–7101.
14. Brüggemann RJ, Antonius T, Heijst Av, Hoogerbrugge PM, Burger DM, Warris A. Therapeutic drug monitoring of voriconazole in a child with invasive aspergillosis requiring extracorporeal membrane oxygenation. Ther Drug Monit. 2008;30(6): 643–646.
The authors
Sahar Rezaei BS; Laura Collier MLS(ASCP); Sara Taylor* PhD, MLS(ASCP)MB
Tarleton State University, Fort Worth, TX, USA
*Corresponding author
E-mail: sataylor@tarleton.edu
Acute chest pain remains the most common reason for emergency hospital admissions in the West, accounting for around 10% of visits. The majority of these patients do not have a life-threatening condition, but around 17% will be diagnosed with acute myocardial infarction (AMI). A physical examination and an ECG or serial ECGs remain essential. Diagnosis is straightforward in patients with typical cardiac symptoms and notable ST-segment deviation, but biomarker testing is necessary in patients with atypical symptoms and non-diagnostic ECGs. Despite huge and sustained efforts by the scientific community during the last six decades, a perfect cardiac biomarker to detect which of these patients have AMI has not yet been found. The cardiac troponin immunoassay, first developed in 1989, has now given rise to a fifth generation hs-cTn immunoassay that is currently used to facilitate the triage of chest pain patients, but is there any scope for improvement in either cardiac biomarker tests or their role in patient management?
The perfect cardiac biomarker would be present in significant concentration in the myocardium but not in any other tissues, and be released rapidly into the blood when MI occurs. It would persist for sufficient duration to allow diagnosis via a rapid and relatively inexpensive assay. Current hs-cTn assays can detect cardiac troponin release within 3 hours and MI can be ruled out in the approximately 60% of chest pain patients who have undetectable levels, or levels below the 99th percentile upper reference limit of a healthy population; the negative predictive value is nearly 100%. Tests are cost-effective and fairly rapid: central labs are able to provide results within an hour, and POC test results can be available within 10 to 20 minutes. However, predictably, the increased sensitivity of hs-cTn assays lowers specificity, resulting in values above normal in patients with conditions other than MI, including atrial fibrillation, hypertension, hepatic and renal disorders, acute and chronic pulmonary disease and even some allergic reactions. Using the currently set diagnostic cut-off for MI, the low positive predictive value results in approximately 22% of chest pain patients without MI remaining in hospital under observation.
Is cTn the best cardiac biomarker that will ever be available, or is it possible that an ever-increasing knowledge of the pathophysiology of acute cardiac disease together with current technological advances may eventually discover the perfect biomarker? Until this happens hs-cTn assays, with probable refinements in their use, will remain an integral part of suspected MI patient management.
This article describes the experiences of the Virology Department at Toulouse University Hospital, France, in the evaluation of a new, fully automated molecular diagnostics system for the quantitative determination of nucleic acid targets, such as cytomegalovirus (CMV) DNA and human immunodeficiency virus type 1 (HIV-1) RNA.
by Prof. Jacques Izopet
The 3000-bed Toulouse University Hospital is one of the leading medical facilities in France with a number of research specialties, including immunology and infectious diseases, cardiovascular and metabolic diseases, and oncology. The hospital’s department of biomedical sciences, which employs over 120 medical biologists and 450 engineers and technicians, performs around 6.6 million tests every year. Among these, the department of virology performs a range of culture, serology and molecular biology investigations.
The virology department’s molecular biology laboratory faces a number of challenges in performing viral load analyses for targets, such as cytomegalovirus (CMV) and human immunodeficiency virus type 1 (HIV-1). For CMV, optimal automated quantitative molecular methods are needed to monitor infection, especially among immune-suppressed patients. Similarly, for HIV-1, sensitive biological tools are needed to quantify HIV-1 RNA and to characterize persistent viremia in patients receiving antiretroviral therapy.
These investigations require robust instrumentation and high quality analytical performance. Currently, the laboratory’s viral load measurements are performed using multiple separate instruments for the aliquoting of samples, nucleic acid extraction and amplification/detection. The existing method requires samples to be processed in batches; involves skilled personnel; and is associated with long turnaround times.
Evaluation of a new, fully automated platform
Recently, the laboratory evaluated a new, automated, random access platform for viral load analyses. The DxN VERIS Molecular Diagnostics System (Beckman Coulter) is fully automated from sample entry to result, consolidating DNA or RNA extraction, nucleic acid amplification, quantification and detection onto a single instrument for a number of molecular targets, including CMV, HIV-1, hepatitis B virus (HBV) and hepatitis C virus (HCV).
The aim of the evaluation was to assess the analytical performances of the VERIS CMV assay (for the quantitative determination of CMV DNA in human plasma) and VERIS HIV-1 assay (for the quantitative determination of HIV-1 RNA), and to compare them to the laboratory’s existing method for CMV and HIV-1 (COBAS® AmpliPrep/COBAS® TaqMan® [Roche] coupled to a Hamilton liquid handling system). The laboratory also investigated differences in workflow, comparing the fully automated DxN VERIS System to the existing, semi-automated method.
CMV performance results
The analytical performance of the VERIS CMV assay system was very good. It demonstrated very high sensitivity and specificity, very good intra/inter-assay reproducibility (both with high viral loads and also when CMV-DNA loads were close to the threshold used to initiate therapy) and a wide analytical range (see Table 1) [1-4].
The clinical performance of the VERIS CMV assay was compared to the laboratory’s existing method for CMV viral load measurement using 169 CMV-positive clinical samples. The two methods were concordant for 88.2% of samples [3,4]. There was good agreement for positive clinical specimens tested by both techniques [1,3,4]. Bland-Altman analysis showed that mean viral loads obtained using the VERIS CMV assay were higher than those obtained using the existing method, with a standard deviation of 0.41 log10IU/mL [4] (Figure 1).
For discordant results, 18/20 (90%) samples tested positive with the VERIS CMV assay and negative with the existing method [3], confirming the very high sensitivity of the VERIS assay [4].
Both assays were also compared for patient monitoring, using four successive samples collected from 17 immunosuppressed patients. This comparison revealed similar trends between the two assays, with overlapping patterns and higher viral loads obtained with the VERIS CMV assay [1,3,4] (Figure 2).
HIV-1 performance results
The VERIS HIV-1 assay demonstrated excellent analytical performance with high sensitivity and specificity, excellent intra/inter-assay reproducibility, and very good linearity across a broad analytical range (table 1) [5,6]. Preliminary data also indicates that there is no influence of HIV-1 subtype on the quantification [6].
The clinical performance of the VERIS HIV-1 assay was assessed using 114 HIV-1 positive samples (mostly HIV-1 subtype B) from Toulouse University Hospital. Passing-Bablok analysis demonstrated that the clinical performance of the VERIS HIV-1 assay correlated well with the existing HIV-1 viral load method, with a small bias for high concentrations (figure 3) [5]. Bland-Altman analysis revealed that the mean difference of HIV-1 RNA concentration obtained using the VERIS HIV-1 assay compared to the existing method was 0.41 log copies/mL (Figure 4) [5,6].
The performance of the two assays was also compared using a panel of 252 HIV-1 positive samples from the Saint-Louis Hospital, Paris, which contained both B (121 samples) and non-B (131 samples) subtypes. Passing-Bablok analysis showed good correlation between the assays, with a small bias for high concentrations (for B and non-B subtypes; for B subtypes only; and for non-B subtypes only) [5]. At very low concentrations (<400 copies/mL), the difference between VERIS and Roche assays was very small (<0.2 log copies/mL) [5].
Workflow efficiencies
The DxN VERIS Molecular Diagnostics System is fully-automated with single sample random access and availability of results as soon as each test is complete (i.e. the first result is available in around 70 minutes for DNA tests and around 100 minutes for RNA tests, with subsequent results every 2.5 minutes). Consolidation of sample extraction and amplification/detection in a single automated platform reduces the number of instruments required for viral load determination from three to just one [5]. It also reduces hands-on time, improving sample security and standardization, and offers a more streamlined workflow [4]. With just 4 steps required for operation (loading of samples onto a rack; placing the rack in the DxN VERIS System; starting the run; reading the auto-verified results), the DxN VERIS System has the potential to revolutionize laboratory practice [7], while the capability to interface with the Laboratory Information System (LIS) ensures ASTM compliance in this respect.
In a workflow analysis for HIV-1 viral load testing at the Toulouse laboratory, the DxN VERIS System was found to reduce complexity of use, with fewer steps (daily maintenance, pre-analytical and post-analytical) and fewer consumables (reduced from >10 to 5) compared to the existing method [5].
The DxN VERIS System also reduced turnaround times for results. The difference in turnaround times between the DxN VERIS System and the existing method was over 25 hours in favour of the DxN VERIS System when the weekend was not taken into account, and over 49 hours in favour of the DxN VERIS System when the weekend was taken into account (figure 5) [5].
Conclusions
In the evaluation at Toulouse University Hospital, the DxN VERIS System demonstrated good analytical and clinical performances in the quantitative determination of CMV DNA and HIV-1 RNA in plasma samples [1-7], comparing well to the laboratory’s existing methodology [1-7] and satisfying quality requirements for the routine monitoring of viral loads in plasma samples [2,4]. It is a completely automated platform, from primary patient sample to result, making it easy-to-use and reliable [1], and offering major improvement in laboratory workflows [5].
The simplified workflow and reduced manual intervention saves staff time, allowing them to focus on other tasks, such as research and innovation [7]. In addition, the single sample random access capabilities of the DxN VERIS System allow laboratories to process samples whenever they are required, without the need for batching, which allows faster results and provides a better service for clinicians and patients [7].
References
1. Mengelle, C, Sauné, K, Haslé, C et al (2014) VERIS/MDx System CMV Assay: a new automated molecular method for quantifying cytomegalovirus-DNA in plasma. Poster presentation, RICAI 2014.
2. Mengelle, C, Sauné, K, Haslé, C (2015) Performance of a completely automated system for monitoring CMV DNA in plasma. Poster presentation, ECCMID, Copenhagen, 2015.
3. Izopet, J, Mengelle, C, Sauné, K (2015) Performance of a new completely automated system for monitoring CMV DNA, HBV DNA, HCV** and HIV** RNA in plasma*. Presented at ECCMID 2015.
4. Mengelle, C, Sandres-Sauné, K, Mansuy, J et al. (2016) Performance of a completely automated system for monitoring CMV DNA in plasma. Journal of Clinical Virology 79: 25–31.
5. Izopet, J (2016) Quantifying HIV-1 RNA with DxN VERIS, a new fully-automated system. Presented at ECCMID 2016.
6. Sauné, K, Haslé, C, Boineau, J (2015) Analytical performance of VERIS MDx system HIV assay for quantifying HIV RNA. Poster presentation, ESCV, Edinburgh, 2015.
7. Izopet, J (2015) Workflow Transformed: A New Fully-automated System for Molecular Diagnostics. Presented at EuroMedLab, Paris , 2015.
The author
Professor Jacques Izopet, Department of Virology, Institut Fédératif de Biologie, CHU Toulouse, France.
Identification of a serum or urine paraprotein is a key element in the diagnosis of multiple myeloma. Traditionally, this has been achieved using a combination of serum and urine electrophoresis, but this can result in incomplete investigation. The use of serum free light chains as an alternative screening test has been advocated to overcome this.
by David Baulch and Beverley Harris
Multiple myeloma
Multiple myeloma (MM) accounts for 1% of all cancers, with nearly 5000 people in the UK being diagnosed each year. The average age of presentation is 70 with only 15% of patients presenting at less than 60 years of age [1]. Its prevalence has increased by 11% in the last decade, due mainly to increased survival rates in those diagnosed [2]. Despite this, MM still accounts for around 2700 deaths annually in the UK and over 70 000 worldwide with a median survival of only 3–4 years from diagnosis [3].
MM is characterized by the accumulation of clonal plasma cells, predominantly within the bone marrow, and subsequent clonal expansion of the plasma cell lineage [4]. It is almost always preceded by a premalignant, asymptomatic period of monoclonal gammopathy of undetermined significance (MGUS) [1]. The process of immunoglobulin (Ig) production by plasma cells is normally under a state of homeostasis, but random and non-random genetic aberrations, epigenetic changes and atypical interactions within the bone marrow microenvironment can cause uncontrolled proliferation of neoplastic plasma cells, leading to plasma cell disorders (PCDs) such as MM [4]. Clonal expansion of a plasma cell line under such circumstances can cause overproduction of intact monoclonal Ig (IgG, IgA, IgM, rarely IgD and IgE) or monoclonal free light chains (FLCs) kappa and lambda. Although the classification of PCDs is based on the immunoglobulin type secreted, 1–2% of MM cases are classified as non-secretory. This may be due to an absence of secreted monoclonal protein (M protein), or secretion at a concentration below the limits of the laboratory methods used for detection.
Compared with other cancers, diagnosis of MM is challenging. Patients present with a range of non-specific symptoms and as a result often have a string of primary care consultations resulting in diagnostic delay. Such delays significantly impact the clinical course of MM [5], for which a complete cure remains elusive.
Consequences of diagnostic delay
Studies have shown that over 50% of patients attending primary care institutions took 6 months (33% >12 months) from the onset of the first related symptoms to referral [5]. Another study showed the time to diagnosis of MM can be unacceptably prolonged [6] and the pathway to diagnosis in MM was more likely to include a string of repeated primary care consultations, infrequent use of urgent referral routes and increased emergency presentation [7]. In particular, patients whose referral was delayed by 6 months or more were more likely to suffer a greater number of more significant complications such as renal insufficiency which, if swift diagnosis had occurred, may have been reversible [5]. This highlights the need not only to raise awareness of disease symptoms, but to increase the sensitivity of laboratory detection.
Laboratory investigation of multiple myeloma
In addition to clinical and hematological investigations, screening for MM within the laboratory is based on the detection and classification of M proteins by serum protein electrophoresis (the separation of serum proteins according to molecular size, hydrophobicity and electric charge [8]), followed by immunofixation or immunotyping to identify and quantify the Ig isotypes. This method is less reliable for detecting disease when only FLCs are secreted, as these are rapidly cleared by the kidneys. Free light chains in the urine [known as Bence Jones protein (BJP)] can also be detected by electrophoresis followed by immunofixation. However, this methodology is time consuming and may not detect low concentration BJP in dilute urine samples [9]. Interpretation of the results can be difficult and should be performed by appropriately qualified and experienced laboratory staff. In addition, obtaining both urine and serum samples for screening can be problematic, with some laboratories reporting that both samples are received for only ~17% of MM screens.
There is growing evidence to support the direct measurement and quantitation of serum kappa and lambda FLCs in diagnosis, monitoring and prognosis of MM and related PCDs [4]. The serum FLC (sFLC) assay (The Binding Site™) was first developed in 2001 [10]. It is an immunoturbidimetric method using latex-enhanced polyclonal sheep antibodies targeted to epitopes on the light chains of Ig that are exposed when the light chain is ‘free’, i.e. not bound to heavy chain Ig. Results are expressed as a ratio of kappa : lambda light chains.
This sFLC assay can be used to replace traditional urine methods for the laboratory detection of FLCs. This practice has the obvious benefit of using a single serum sample and eliminating the need for a paired urine sample, which may not always be supplied. In addition to the reported increased diagnostic sensitivity of the sFLC assay, an unexpected finding by Dispenzieri et al. was that baseline sFLC results can be used in prognostication and risk stratification of MGUS [11]. Although the rationale for this is poorly understood, it is thought that a greater degree of abnormality in the sFLC ratio reflects an increasing tumour burden.
Studies such as these have informed changes to MM guidelines published in 2016 [12] to acknowledge that significantly abnormal FLC ratios, in the absence of clinical features of end organ damage, can be used in the diagnosis of MM [4]. This eliminates a traditional major challenge with MM diagnosis in that disease definition was clinicopathological. The use of the sFLC ratio in this way therefore marks a milestone in the early detection of MM and highlights a disease transition to being a laboratory-defined rather than a symptom-defined disease, allowing for earlier intervention.
There is, however, controversy as to whether the sFLC assay is indeed a robust candidate for inclusion in PCD screening strategies. There is currently only limited guidance on how it should be used in clinical practice [4] and there is ongoing debate regarding result interpretation, especially for those mildly abnormal ratios. There are, therefore, many considerations to be made before such screening could be implemented.
Study overview and results
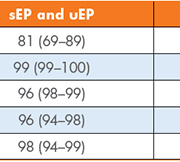
Our real-time prospective study aimed to assess the clinical utility of three index laboratory investigations [serum and urine protein electrophoresis (sEP and uEP) and sFLC] to determine the most effective first-line testing strategy for detecting PCDs in primary care patients. These laboratory investigations were performed on 446 samples with no previous history of, or investigations for, MM. The sensitivity, specificity, positive predictive value (PPV), negative predictive value (NPV) and efficiency were calculated for our current screening tests (sEP and uEP) and the use of sEP with sFLC as an alternative strategy. Figures 1 and 2 outline the process for each of these screening strategies and a summary of the results is given in Table 1.
Conclusion
The purpose of a medical screening programme is to recognize a disease in its preclinical phase to allow intervention at an earlier stage. Such strategies have benefits, risks and costs and the final screening algorithm is often a compromise between these three. However, a proposed screening strategy should fulfil the criteria outlined by Wilson and Jungner in 1968 [13]. Of note, criterion 4 suggests there should be a detectable preclinical stage, in this case MGUS, and criterion 5 suggests there should be a suitable test for screening strategies. This real-time prospective study presents evidence of the clinical utility of the sFLC assay and its use in developing a more sensitive screening strategy for PCD detection.
Standard screening practice combining sEP and uEP increased the sensitivity of the constituent index tests (78% and 30% respectively) to 81%, meaning the addition of urinalysis to sEP increased the sensitivity by only 3%. This reinforces the need for a more sensitive method for detecting sFLC than sEP alone. This combination also displayed a good PPV without compromising efficiency (98%). Despite this, its use missed significant cases of PCDs including a light-chain multiple myeloma, a possible but unconfirmed (in the time frame of the study) case of MM and 10 cases of MGUS, highlighting its limitation as a first line screening investigation.
Combining sEP with sFLC analysis increased the sensitivity from sEP alone by 20% (data not shown), again suggesting singular sEP testing is not sensitive enough to detect minor abnormalities in FLC production. This proposed combination of screening tests increased sensitivity by 17% when compared with current protocols, indicating that the sFLC assay is more sensitive than urinalysis for detecting PCDs. The sFLC assay has been demonstrated to show a high sensitivity for light chain MM and non-secretory MM [14]. These often present with normal sEP and uEP, especially in low tumour burden stages when renal function remains adequate, which may explain the increased sensitivity of sFLC over uEP.
The results of this study confirm also those of others [15], which show that the addition of sFLC analysis to sEP increases the detection of MM and related PCDs. In our case, there was a 17% increase in patients with a PCD detected. However, a concurrent rise in false positive results (10%) was also seen when compared to traditional screening protocols. Investigation into this was beyond the scope of our study, though the false positive rate could potentially be reduced by employing screening strategies that apply renal reference intervals for the sFLC ratio for those with renal insufficiency.
Summary
On balance, there are several advantages to replacing urinalysis with the sFLC assay. These include increased clinical sensitivity for detection of early-stage disease, patient convenience in submitting a single serum sample rather than two separate specimens, increased use of automation and reduction in subjectivity in reporting of results. However, it is also important to consider the potential increased cost of performing sFLC on all samples submitted for myeloma screening, the importance of using appropriate reference ranges and the need to develop guidelines for interpretation of borderline results. This latter point is particularly important in order that unnecessary referrals are prevented, and should involve close liaison with local hematology teams to ensure that primary care clinicians are given clear guidance for further investigation and referral of their patients.
References
1. Bird JM, Owen RG, D’Sa S, Snowden JA, Pratt G, Ashcroft J, Yong K, Cook G, Feyler S, et al. Guidelines for the diagnosis and management of multiple myeloma 2011. Br J Haematol. 2011; 154(1): 32–75.
2. Brenner H, Gondos A, Pulte D. Expected long-term survival of patients diagnosed with multiple myeloma in 2006–2010. Haematologica 2009; 94(2): 270–275.
3. Rajkumar SV, Kyle RA, Therneau TM, Melton LJ, III, Bradwell AR, Clark RJ, Larson DR, Plevak MF, Dispenzieri A, Katzmann JA. Serum free light chain ratio is an independent risk factor for progression in monoclonal gammopathy of undetermined significance. Blood 2005; 106(3): 812–817.
4. Rajkumar SV, Dimopoulos MA, Palumbo A, Blade J, Merlini G, Mateos MV, Kumar S, Hillengass J, Kastritis E, et al. International Myeloma Working Group updated criteria for the diagnosis of multiple myeloma. Lancet Oncol. 2014; 15(12): e538–548.
5. Kariyawasan CC, Hughes DA, Jayatillake MM, Mehta AB. Multiple myeloma: causes and consequences of delay in diagnosis. QJM 2007; 100(10): 635–640.
6. Howell DA, Smith AG, Jack A, Patmore R, Macleod U, Mironska E, Roman E. Time-to-diagnosis and symptoms of myeloma, lymphomas and leukaemias: a report from the Haematological Malignancy Research Network. BMC Hematol. 2013; 13(1): 9.
7. Elliss-Brookes L, McPhail S, Ives A, Greenslade M, Shelton J, Hiom S, Richards M. Routes to diagnosis for cancer – determining the patient journey using multiple routine data sets. Br J Cancer 2012; 107(8): 1220–1226.
8. Bossuyt X. Separation of serum proteins by automated capillary zone electrophoresis. Clin Chem Lab Med. 2003; 41(6): 762–772.
9. Kaplan IV, Levinson SS. Misleading urinary protein pattern in a patient with hypogammaglobulinemia: effects of mechanical concentration of urine. Clin Chem. 1999; 45(3): 417–419.
10. Bradwell AR, Carr-Smith HD, Mead GP, Tang LX, Showell PJ, Drayson MT, Drew R. Highly sensitive, automated immunoassay for immunoglobulin free light chains in serum and urine. Clin Chem. 2001; 47(4): 673–680.
11. Dispenzieri A, Kyle R, Merlini G, Miguel JS, Ludwig H, Hajek R, Palumbo A, Jagannath S, Blade J, et al. International Myeloma Working Group guidelines for serum-free light chain analysis in multiple myeloma and related disorders. Leukemia 2009; 23(2): 215–224.
12. Myeloma: diagnosis and monitoring. National Institute for Health and Care Excellence (NICE) 2016. (https://www.nice.org.uk/guidance/ng35)
13. Wilson JM, Jungner YG. [Principles and practice of mass screening for disease]. Bol Oficina Sanit Panam. 1968; 65(4): 281–393 (in Spanish).
14. Jagannath S. Value of serum free light chain testing for the diagnosis and monitoring of monoclonal gammopathies in hematology. Clin Lymphoma Myeloma 2007; 7(8): 518–523.
15. McTaggart MP, Lindsay J, Kearney EM. Replacing urine protein electrophoresis with serum free light chain analysis as a first-line test for detecting plasma cell disorders offers increased diagnostic accuracy and potential health benefit to patients. Am J Clin Pathol. 2013; 140(6): 890–897.
The authors
David Baulch* MSc, Beverley Harris MSc, FRCPath
Department of Clinical Biochemistry, Royal United Hospitals Bath NHS Foundation Trust, Bath, UK
*Corresponding author
E-mail: david.baulch@nhs.net
November 2024
The leading international magazine for Clinical laboratory Equipment for everyone in the Vitro diagnostics
Beukenlaan 137
5616 VD Eindhoven
The Netherlands
+31 85064 55 82
info@clinlabint.com
PanGlobal Media is not responsible for any error or omission that might occur in the electronic display of product or company data.
This site uses cookies. By continuing to browse the site, you are agreeing to our use of cookies.
Accept settingsHide notification onlyCookie settingsWe may ask you to place cookies on your device. We use cookies to let us know when you visit our websites, how you interact with us, to enrich your user experience and to customise your relationship with our website.
Click on the different sections for more information. You can also change some of your preferences. Please note that blocking some types of cookies may affect your experience on our websites and the services we can provide.
These cookies are strictly necessary to provide you with services available through our website and to use some of its features.
Because these cookies are strictly necessary to provide the website, refusing them will affect the functioning of our site. You can always block or delete cookies by changing your browser settings and block all cookies on this website forcibly. But this will always ask you to accept/refuse cookies when you visit our site again.
We fully respect if you want to refuse cookies, but to avoid asking you each time again to kindly allow us to store a cookie for that purpose. You are always free to unsubscribe or other cookies to get a better experience. If you refuse cookies, we will delete all cookies set in our domain.
We provide you with a list of cookies stored on your computer in our domain, so that you can check what we have stored. For security reasons, we cannot display or modify cookies from other domains. You can check these in your browser's security settings.
.These cookies collect information that is used in aggregate form to help us understand how our website is used or how effective our marketing campaigns are, or to help us customise our website and application for you to improve your experience.
If you do not want us to track your visit to our site, you can disable this in your browser here:
.
We also use various external services such as Google Webfonts, Google Maps and external video providers. Since these providers may collect personal data such as your IP address, you can block them here. Please note that this may significantly reduce the functionality and appearance of our site. Changes will only be effective once you reload the page
Google Webfont Settings:
Google Maps Settings:
Google reCaptcha settings:
Vimeo and Youtube videos embedding:
.U kunt meer lezen over onze cookies en privacy-instellingen op onze Privacybeleid-pagina.
Privacy policy